yahoo Press
Is Synchrony Financial Stock Underperforming the S&P 500?
Images

1 / 6

2 / 6

3 / 6

4 / 6
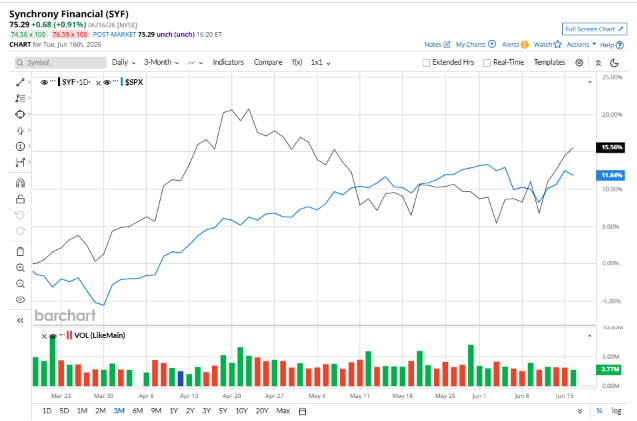
5 / 6

6 / 6
The above button links to Coinbase. Yahoo Finance is not a broker-dealer or investment adviser and does not offer securities or cryptocurrencies for sale or facilitate trading. Coinbase pays us for certain activity generated through this link. Prices displayed are informational.

Stamford, Connecticut-based Synchrony Financial (SYF) is a premier consumer financial services company delivering one of the industry's most complete digitally-enabled product suites. Valued at $25.1 billion by market cap, the company provides a range of credit products such as credit cards, commercial credit products, and consumer installment loans through programs established with a diverse group of national and regional retailers, local merchants, manufacturers, and more.

Companies worth $10 billion or more are generally described as “large-cap stocks,” and SYF perfectly fits that description, with its market cap exceeding this mark, underscoring its size, influence, and dominance within the credit services industry. SYF's market leadership is fueled by its vast partner network, comprising national retailers, local merchants, and healthcare providers, paired with a robust digital platform. This digital focus aligns with consumer trends and enhances customer engagement.

Rocket Lab vs. Redwire: 1 Stock Has the Stronger Growth Story for the Next Decade

Dear SpaceX Stock Fans, Mark Your Calendars for June 16

Dear Western Digital Stock Fans, Mark Your Calendars for June 22

Get exclusive insights with the FREE Barchart Brief newsletter. Subscribe now for quick, incisive midday market analysis you won't find anywhere else.

Despite its notable strength, SYF shares have slipped 15.2% from their 52-week high of $88.77, achieved on Jan. 9. Over the past three months, SYF stock has gained 17.6%, outperforming the S&P 500 Index’s ($SPX) 11.8% gains during the same time frame.

Shares of SYF fell 9.8% this year but climbed 22.9% over the past 52 weeks, underperforming SPX’s YTD gains of 9.7% and 25.6% returns over the same time frame.

To confirm the bullish trend, SYF has been trading above its 50-day and 200-day moving averages recently.

SYF underperformed as rising charge-offs hit consumer lenders when pandemic savings dried up and persistent inflation strained lower-income borrowers. Synchrony responded by tightening underwriting standards, pressuring the stock.

On Apr. 21, SYF shares closed down more than 1% after reporting its Q1 results. Its EPS of $2.27 met Wall Street expectations. The company’s net interest income was $4.6 billion, up 3.8% year over year.

In the competitive arena of credit services, American Express Company (AXP) has taken the lead over SYF, showing resilience with a 7.9% downtick on a YTD basis but lagged behind the stock with 15.8% gains over the past 52 weeks.

Wall Street analysts are moderately bullish on SYF’s prospects. The stock has a consensus “Moderate Buy” rating from the 23 analysts covering it, and the mean price target of $89.41 suggests a potential upside of 18.8% from current price levels.

On the date of publication, Neha Panjwani did not have (either directly or indirectly) positions in any of the securities mentioned in this article. All information and data in this article is solely for informational purposes. This article was originally published on Barchart.com
Comments
You must be logged in to comment.