yahoo Press
NEAR Price Risks 50% Crash as Long Liquidations Pile Up
Images
1 / 4

2 / 4

3 / 4

4 / 4
The above button links to Coinbase. Yahoo Finance is not a broker-dealer or investment adviser and does not offer securities or cryptocurrencies for sale or facilitate trading. Coinbase pays us for certain activity generated through this link. Prices displayed are informational.

NEAR Protocol (NEAR) could fall by roughly 50% if its latest rejection from multi-year resistance triggers a broader liquidation-driven selloff.

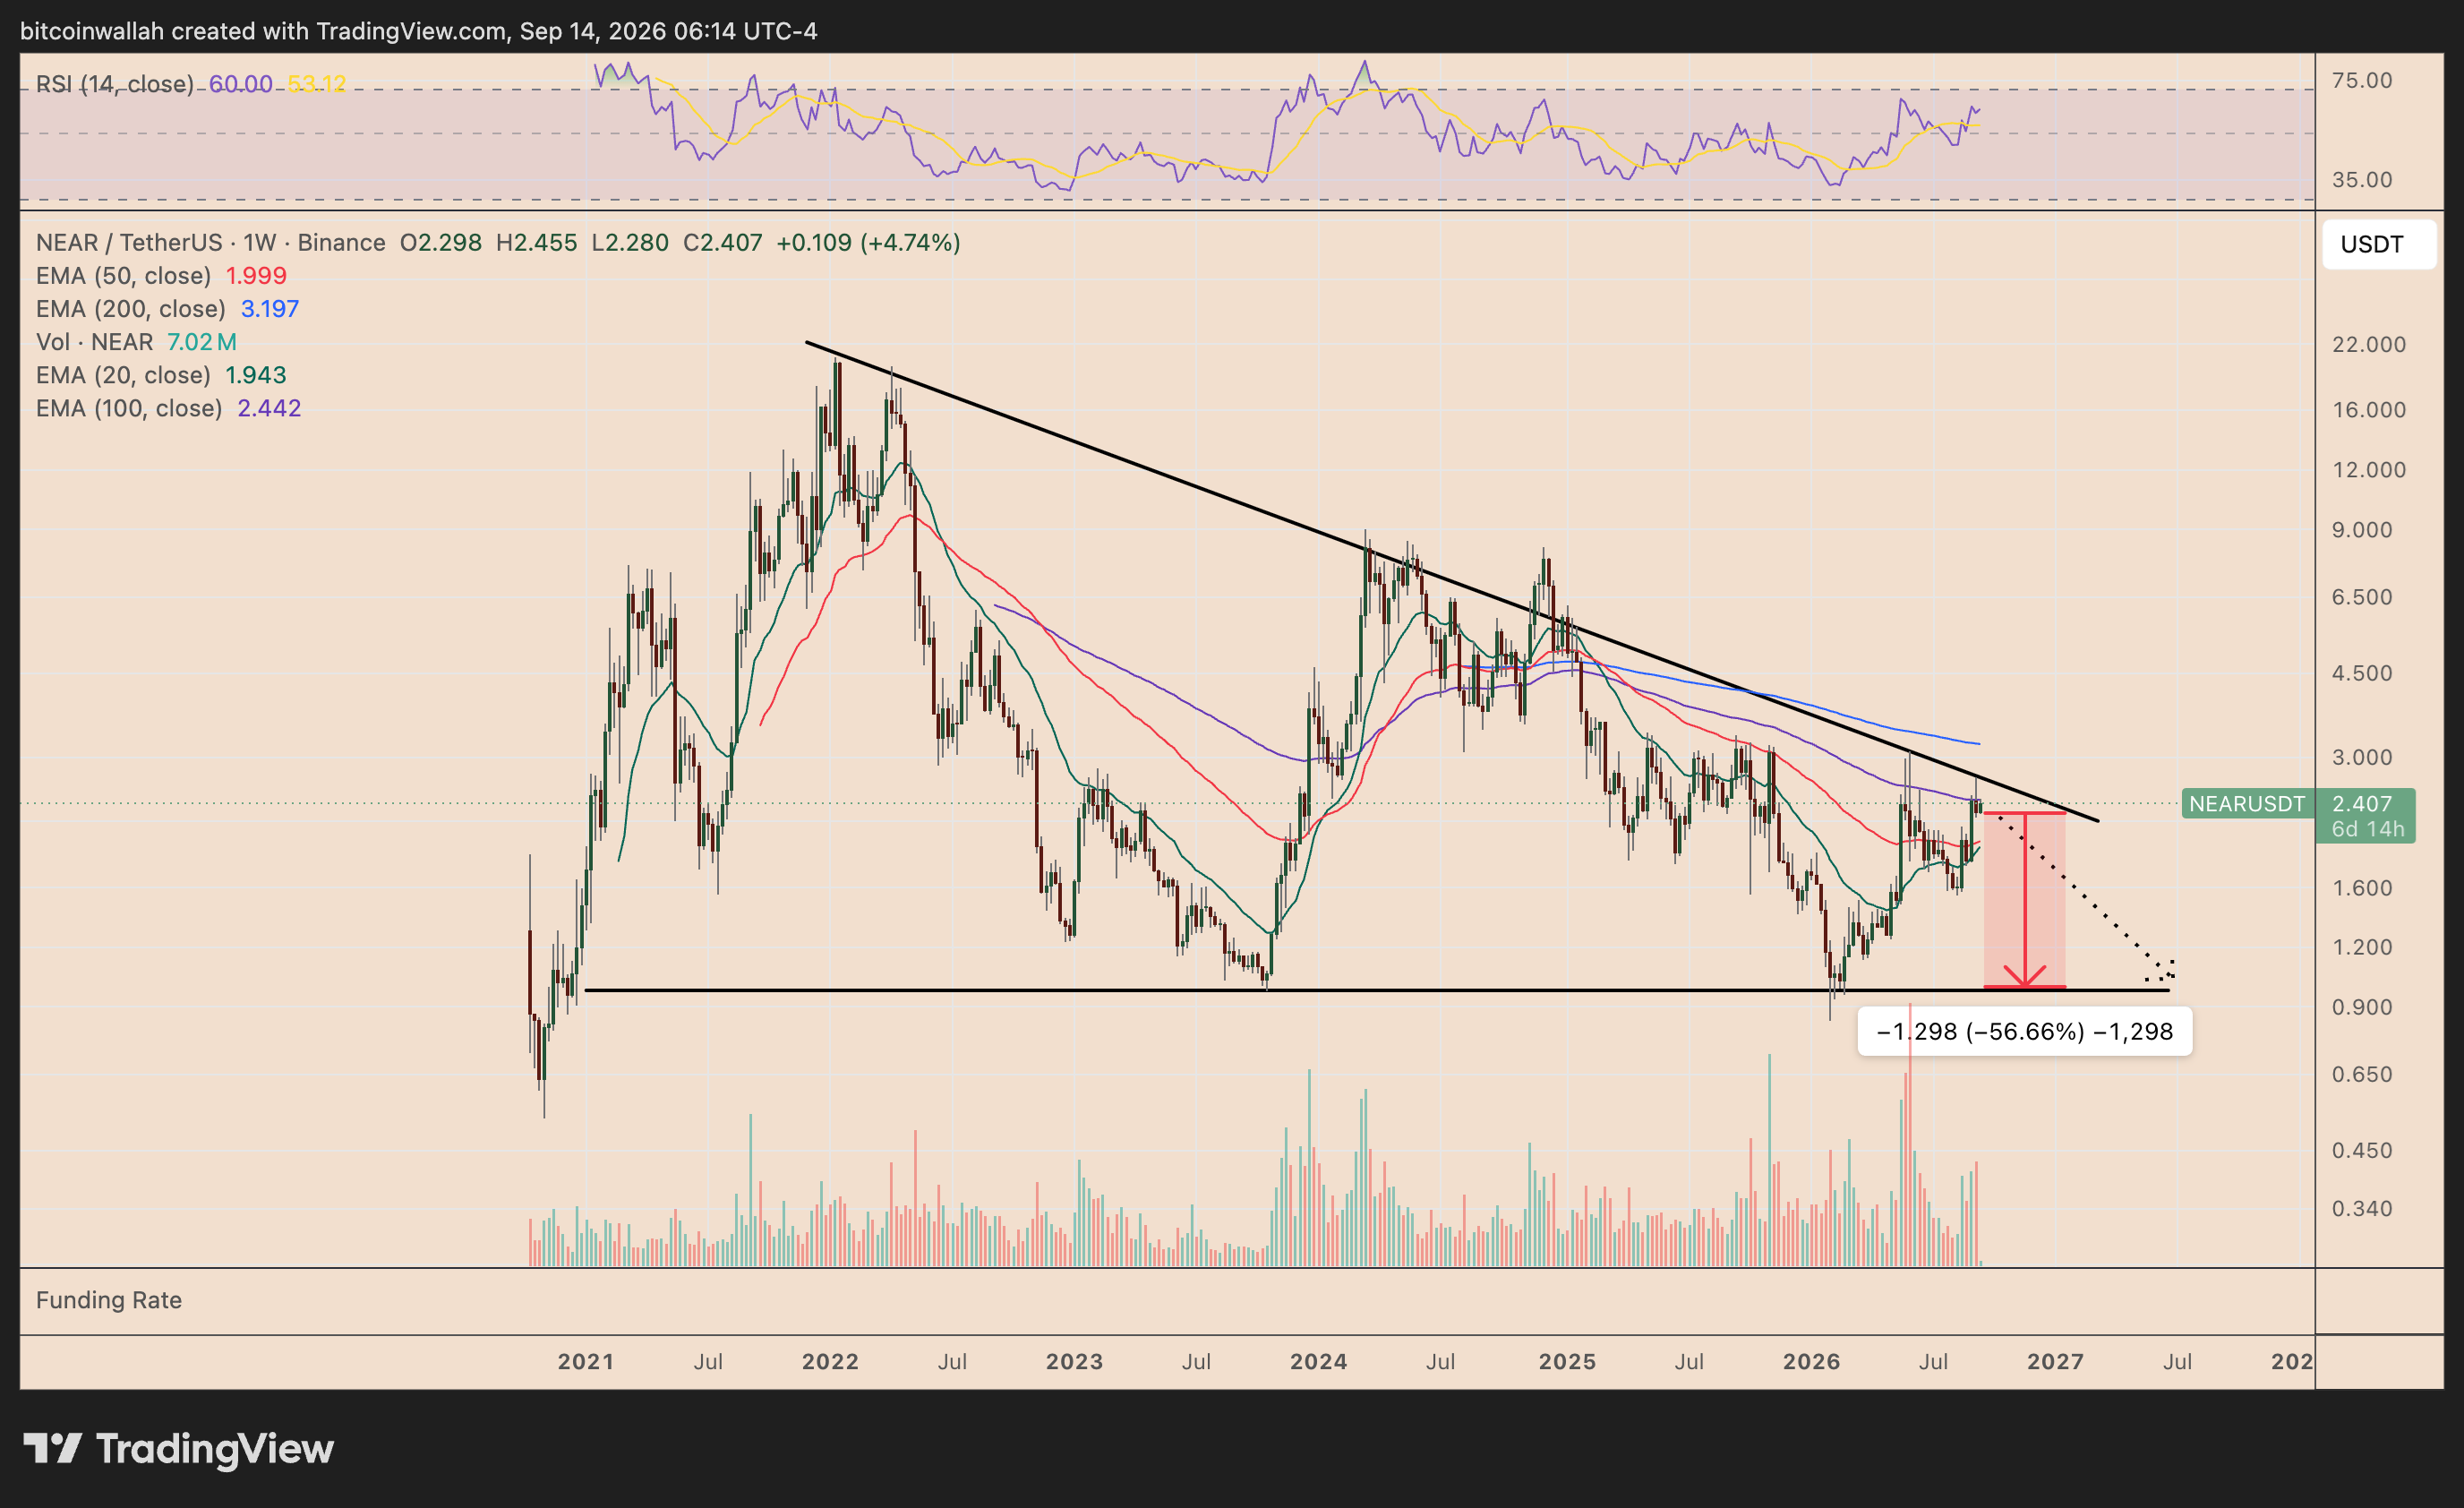
NEAR was trading near $2.40 on Sept. 14 after rebounding sharply from its 2026 low near $1.00. However, the recovery has pushed the token directly into a descending trendline that has capped its upside since the 2022 market peak.

The same resistance structure rejected NEAR during its recovery attempts in 2024 and 2025, raising the possibility of another bearish reversal.

NEAR is also testing its 100-week exponential moving average (100-week EMA, purple), currently near $2.44. Meanwhile, the 200-week EMA (blue) sits considerably higher at around $3.20, adding another layer of long-term resistance above the current price.

A rejection from the $2.40-$2.50 area could initially pull NEAR toward its 50-week (red) and 20-week EMAs (green), located near $2.00 and $1.94, respectively.

A decisive breakdown below those support levels would strengthen the bearish setup, potentially exposing NEAR to its multi-year horizontal support around $1.00-$1.10.

That would amount to a decline of more than 50% from current levels.

Still, a sustained breakout above the descending trendline and $2.50 resistance would weaken the downside scenario.

NEAR's three-month Binance liquidation heatmap adds another downside risk.

The most immediate liquidity "magnet" appears around $2.134, where approximately $1.53 million in leveraged long positions could be liquidated if NEAR falls into the area.

That represents a decline of roughly 11% from the current price.

More importantly, cumulative long liquidations across the downside liquidity clusters stand at approximately $13.03 million, substantially outweighing the visible short-liquidation concentration above the market.

Such an imbalance could amplify a correction if NEAR begins falling.

Liquidation zones are levels where exchanges automatically close highly leveraged positions once traders no longer have sufficient collateral. As those forced sales hit the market, they can accelerate an already-developing decline.

Therefore, a move toward $2.13 could become an important bearish trigger. Further losses toward the $2.00-$1.94 EMA zone would put NEAR's recovery structure under greater pressure.

If those supports fail, the weekly chart leaves the $1.00-$1.10 area as the primary long-term downside target, aligning the liquidation setup with the broader technical scenario for a roughly 50% NEAR price correction.

This article was originally posted on FX Empire

Ethereum Price Prediction: Clarity Act Could Trigger ETH Breakout

Solana Price Prediction: Active Users Signal Big SOL Move

NEAR Price Risks 50% Crash as Long Liquidations Pile Up

Oracle Surges on AI Growth as AMD, Nvidia Stay Bullish

Bitcoin Price Prediction: CPI Bear Trap Puts $85K in Play

WMT, COST and AMZN Forecast: Higher Rates Test Consumers
Comments
You must be logged in to comment.