yahoo Press
Map shows where the 2026 ‘super’ El Niño could bring lots of rain, extreme drought
Images
1 / 8
2 / 8

3 / 8

4 / 8
5 / 8
6 / 8

7 / 8

8 / 8
(NEXSTAR) – A "super" El Niño is gaining strength as we speak. If the climate phenomenon continues building at this pace, it could become the strongest El Niño we've seen in more than 75 years.

Some forecasts indicate it may be the strongest El Niño ever recorded, said Dr. Jeffrey Shaman, senior vice dean and professor at the Columbia Climate School.

But what that means for weather this year depends on where you live. For some parts of the world, El Niño means more wet winter storms. In other places, it can create drought conditions.

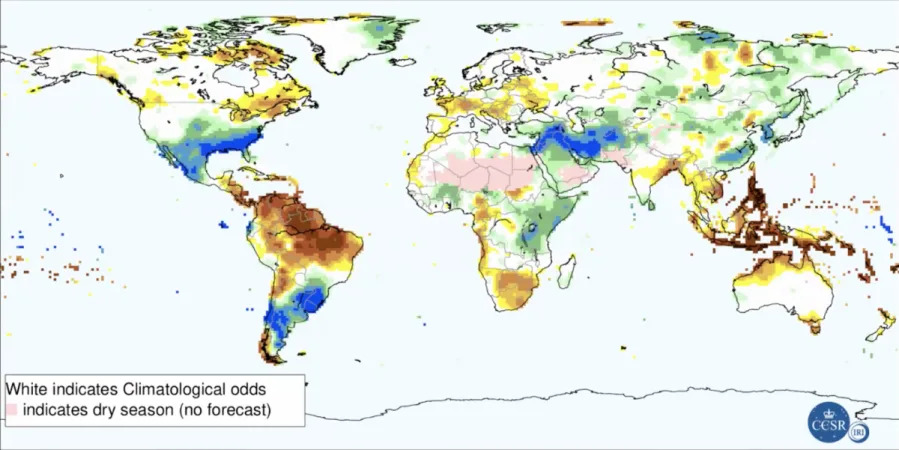
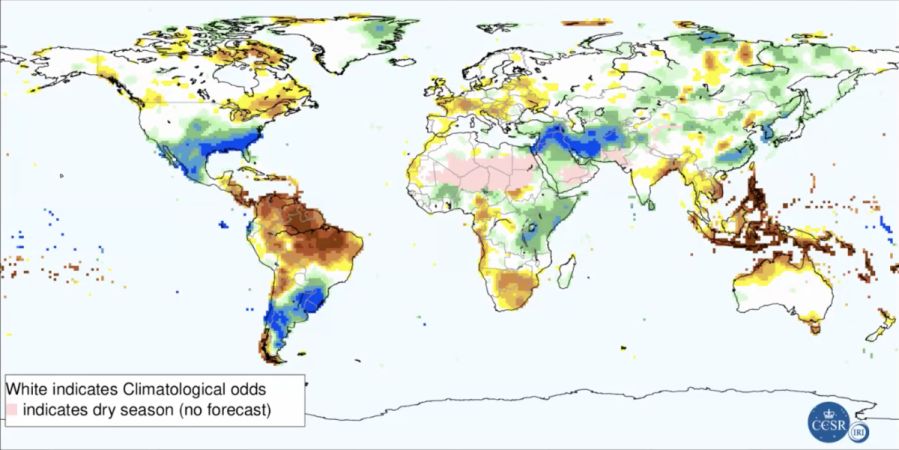
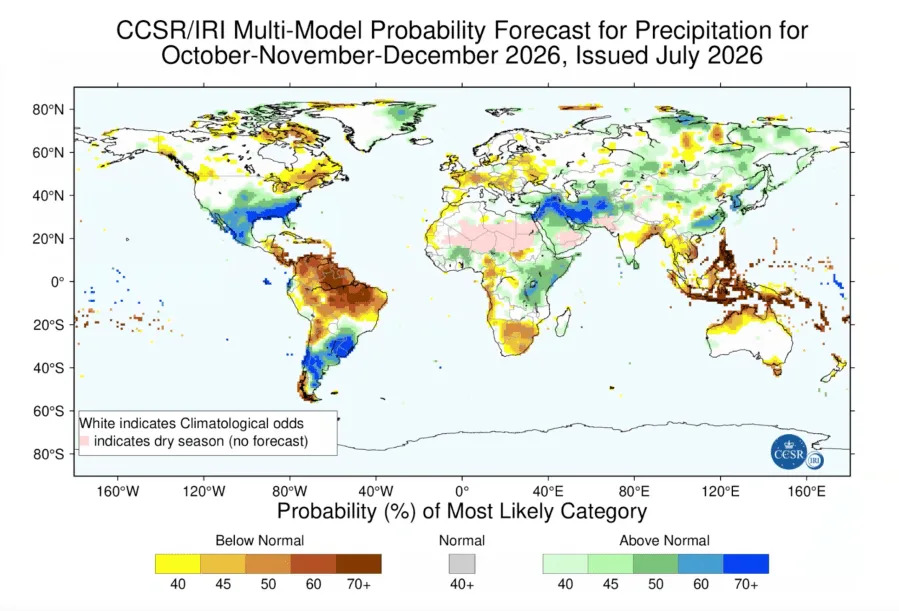
A map created by Columbia University's Center for Climate Systems Research combines multiple models, taking into account this year's El Niño and other climate factors, to predict which places will see more rain and which areas will see less rain than usual from October to the end of the year.

 'Super' El Niño may be strongest since 1950. When will it peak, hit the US?

Parts of the world that are shaded in green and blue have the highest chances of seeing above-normal precipitation this year. In the U.S., it's the southeastern states who have the highest likelihood – above a 70% chance – of more rain than normal.

On the other side of the spectrum are the places shown in yellow and brown. Those areas, like some of the northeastern U.S. states, are more likely to see below-normal precipitation. That could create or exacerbate drought conditions.

(Map: Center for Climate Systems Research, Columbia University)

Other parts of the world, like Brazil and Southeast Asia, have a more dire El Niño-related drought forecast than the U.S.

The map above only shows rainfall predictions through the end of the year, but this super-charged El Niño is likely to stick with us through early 2027.

 NOAA releases fall weather predictions for all 50 states as El Niño grows stronger

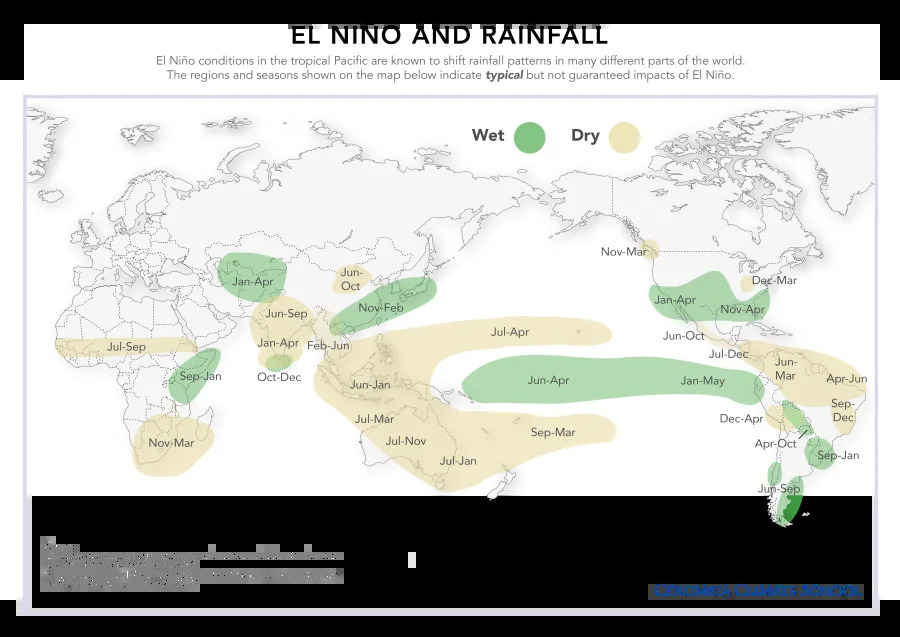
That's when it could start having a bigger effect on the West Coast of the U.S., bringing more rain to Southern California and keeping the Pacific Northwest a little drier. The Ohio Valley also tends to be on the dry side during an El Niño year.

A map shows the typical precipitation patterns globally associated with El Niño. (Map: Columbia Climate School)

Of course, none of these outcomes are a guarantee. "Even the strongest El Niño events do not lead to the typical impact everywhere, but stronger events can more significantly tilt the odds in favor of expected outcomes," the Climate Prediction Center said in a recent update.

There are other elements influencing our climate and weather patterns, like warming global temperatures.

"El Niño is not the only thing that affects these seasonal forecasts, but it is one of the big drivers of it," said Shaman. "It gives a lot of certainty to the forecast."

In its latest forecast, the Climate Prediction Center said the odds that this year's El Niño will reach the highest strength level – often called a "super" El Niño – are now higher than 90%. There's a 69% chance it grows into the strongest El Niño since 1950.

Copyright 2026 Nexstar Media, Inc. All rights reserved. This material may not be published, broadcast, rewritten, or redistributed.For the latest news, weather, sports, and streaming video, head to The Hill.
Comments
You must be logged in to comment.