yahoo Press
Bitcoin May Finally Crash Below $60K As August Curse Kicks In
Images
1 / 4

2 / 4

3 / 4

4 / 4
The above button links to Coinbase. Yahoo Finance is not a broker-dealer or investment adviser and does not offer securities or cryptocurrencies for sale or facilitate trading. Coinbase pays us for certain activity generated through this link. Prices displayed are informational.

Bitcoin (BTC) may be heading for another difficult August, with historical US midterm-year seasonality pointing to a possible drop below $60,000.

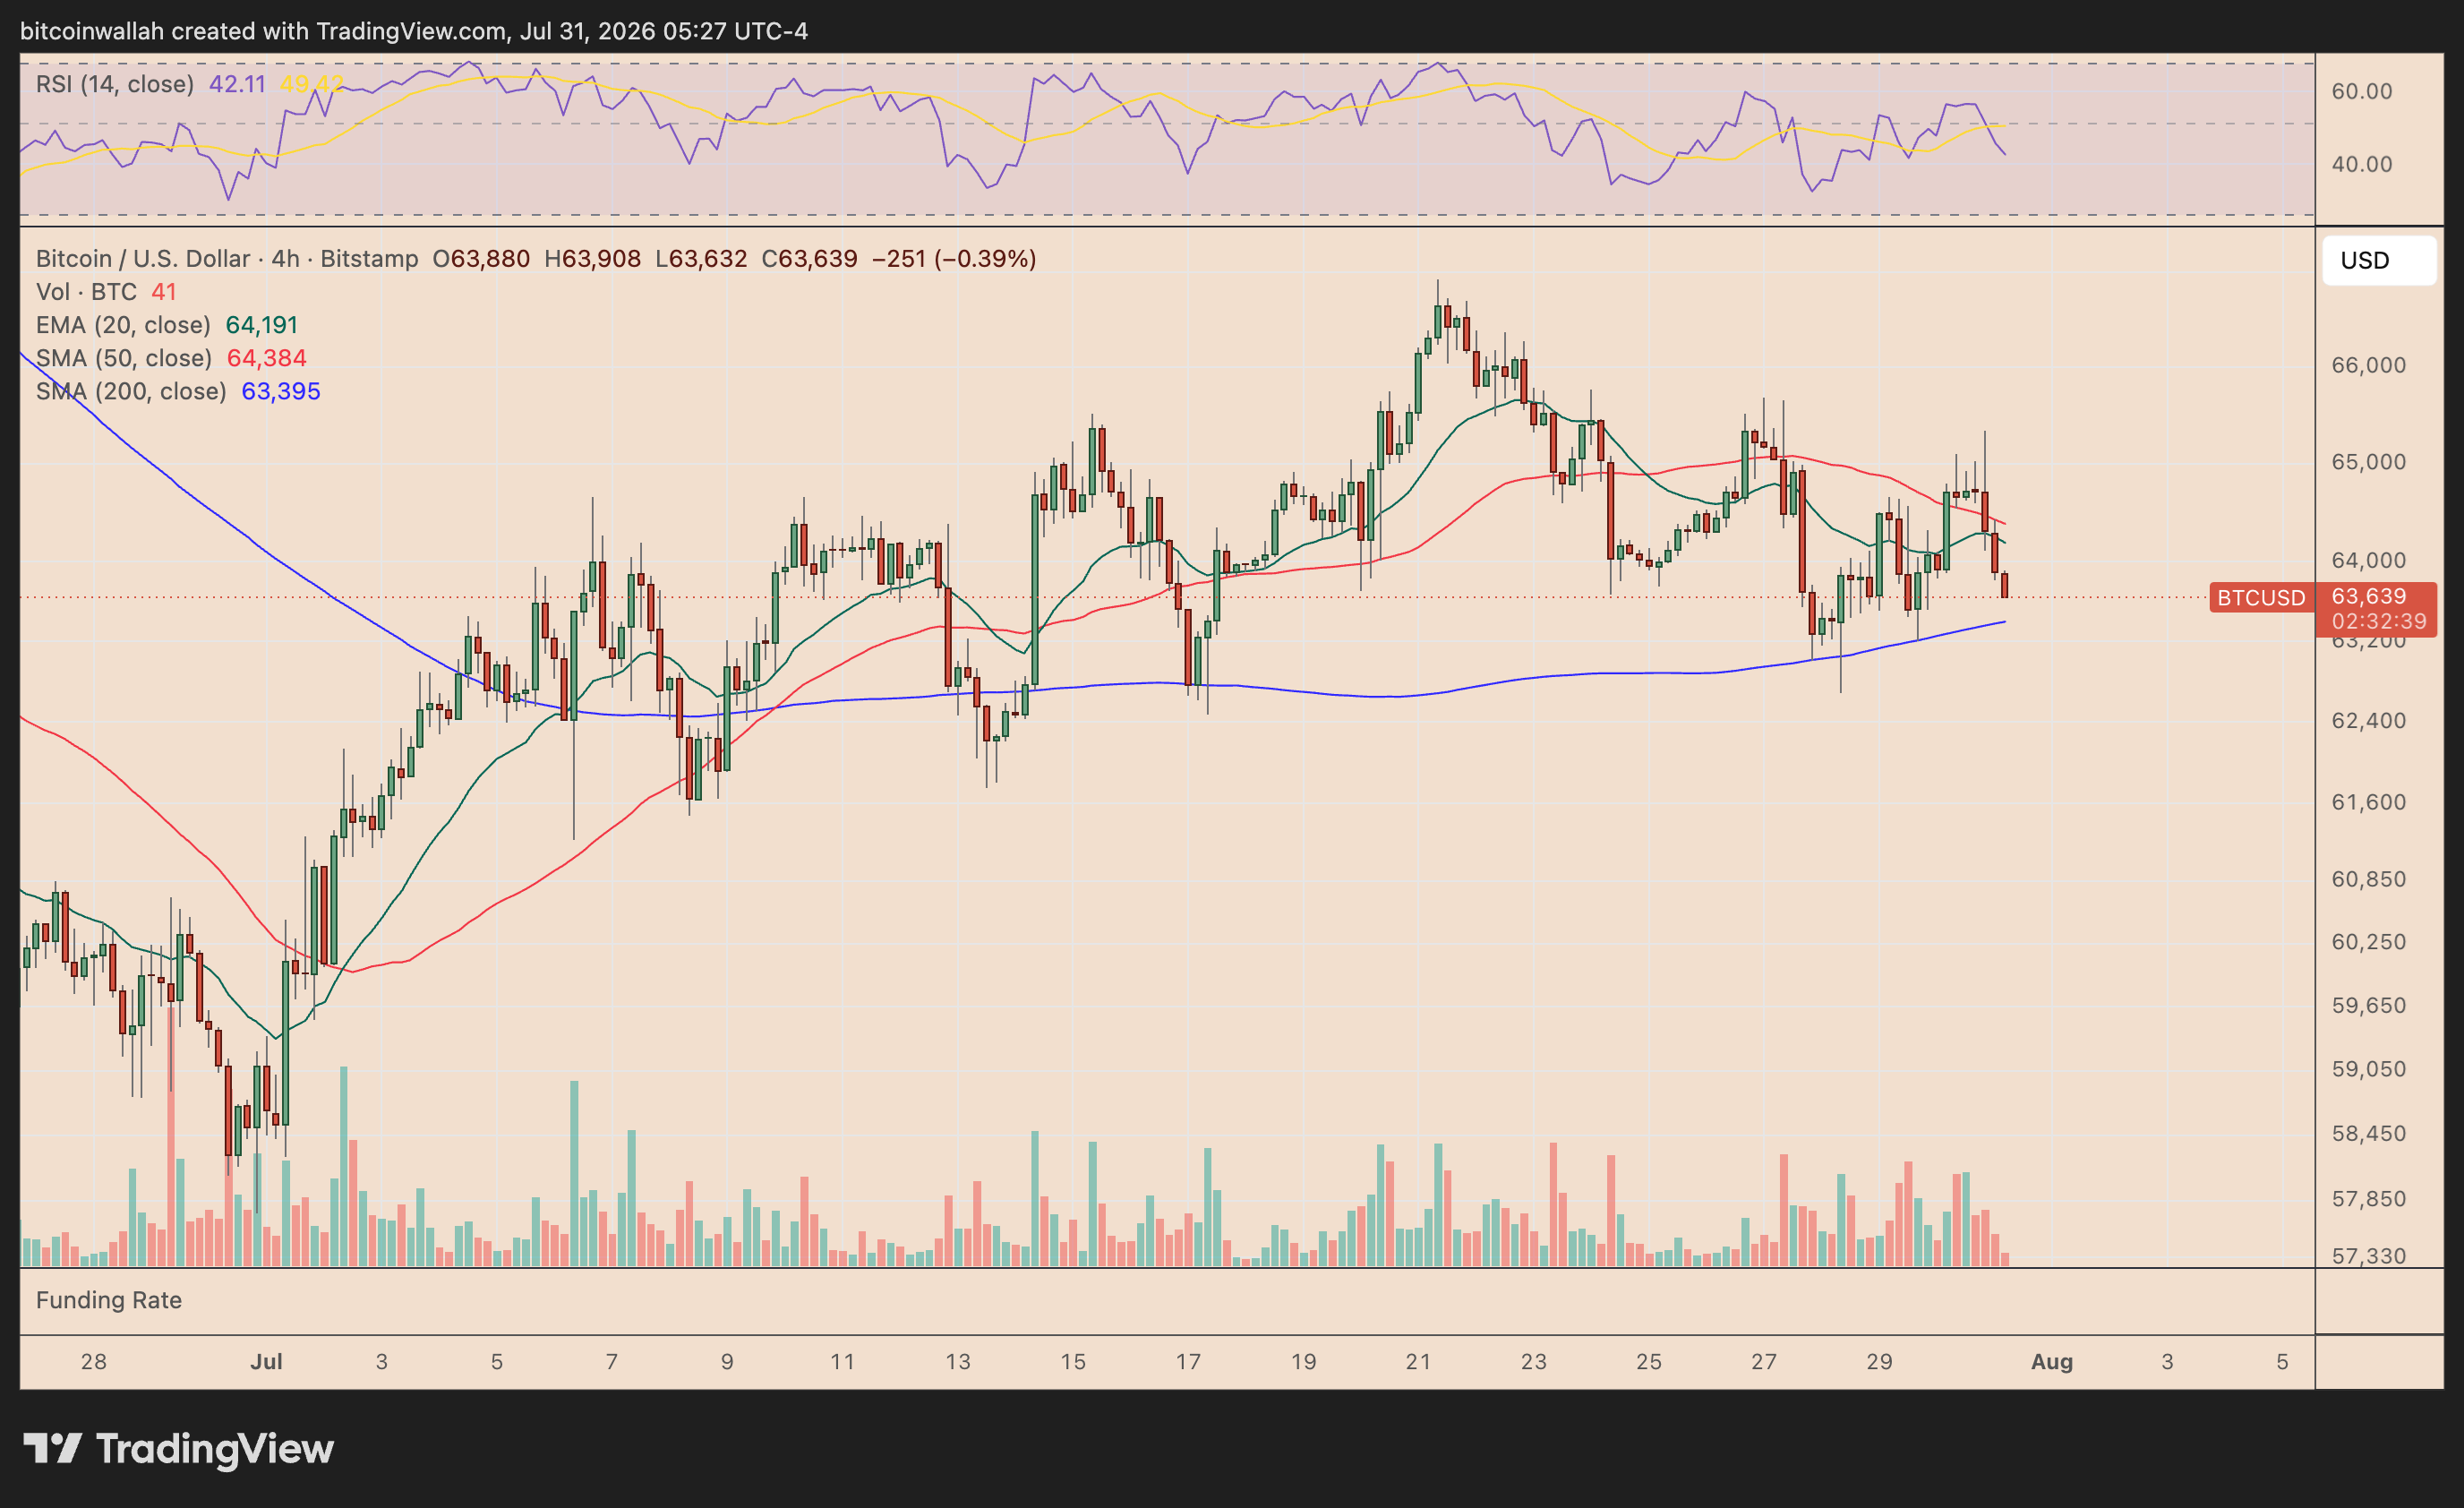
Bitcoin was trading near $63,800 on July 31 after repeatedly struggling to sustain gains above $65,000. A decline of only 6% from current levels would push the cryptocurrency below the psychologically important $60,000 support level.

Since 2013, Bitcoin has produced an average August return of 1.12%, according to data resource CoinGlass. However, that figure is heavily distorted by outsized rallies, including the 65.32% surge in August 2017 and the 30.42% gain in August 2013.

The median August return is a much weaker minus 7.49%, suggesting the typical outcome has been bearish despite the positive average.

The record looks worse during US midterm-election years. Bitcoin fell 17.55% in August 2014, 9.27% in 2018 and 13.88% in 2022. Those declines produce an average loss of roughly 13.6%, with a median return of minus 13.88%.

A similar 13.6% decline from around $64,000 would place Bitcoin near $55,300.

Still, the sample includes only three comparable midterm years. Bitcoin must first lose $60,000 decisively to strengthen the bearish outlook, while holding the level could support another rebound toward $65,000–$68,000.

Bitcoin's daily chart adds another warning through a potential bear pennant, not a bull pennant.

The structure formed after BTC's sharp June decline, which created the flagpole, followed by consolidation between converging trendlines near $60,000–$67,000.

A decisive daily close below the pennant's lower boundary, currently around $61,000–$62,000, could confirm the bearish continuation pattern.

Measuring the June flagpole from the likely breakdown point produces a downside target near $52,200, representing an approximately 18% decline from current prices.

The setup would weaken if Bitcoin breaks above the upper trendline and reclaims the $66,000–$67,000 resistance zone with stronger trading volume over the coming weeks.

Bitcoin could face additional pressure from key US economic data in August.

The July jobs report and inflation readings will shape expectations for the Federal Reserve's September meeting. Strong employment or hotter-than-expected inflation could lift Treasury yields and the dollar, weighing on BTC.

The Jackson Hole symposium later in August may create another volatility spike if Fed officials signal that interest rates must remain higher for longer. Renewed US-Iran tensions and another surge in oil prices could further worsen inflation concerns, impacting risk assets like Bitcoin.

This article was originally posted on FX Empire

3 Reasons Why Ethereum May Continue Its Rally in August

Strong Earnings, Guidance Send Wabtec Shares to New Highs

Arista Networks' Huge AI Sales, Upcoming Earnings Lift Shares

Telegram's GRAM Token Teases 40% Rally Despite Pavel Durov Warrant

Semiconductor Forecasts – AI Stocks Test Support Ahead of Fed

Hyperliquid Price News: HYPE May Rally 25% Despite Short-Term Selloff Risks
Comments
You must be logged in to comment.