yahoo Press
Hyperliquid Price News: HYPE May Rally 25% Despite Short-Term Selloff Risks
Images
1 / 4
2 / 4

3 / 4

4 / 4
The above button links to Coinbase. Yahoo Finance is not a broker-dealer or investment adviser and does not offer securities or cryptocurrencies for sale or facilitate trading. Coinbase pays us for certain activity generated through this link. Prices displayed are informational.

HYPE, the native token of the Hyperliquid decentralized exchange, may rally 25% despite showing short-term downside risks.

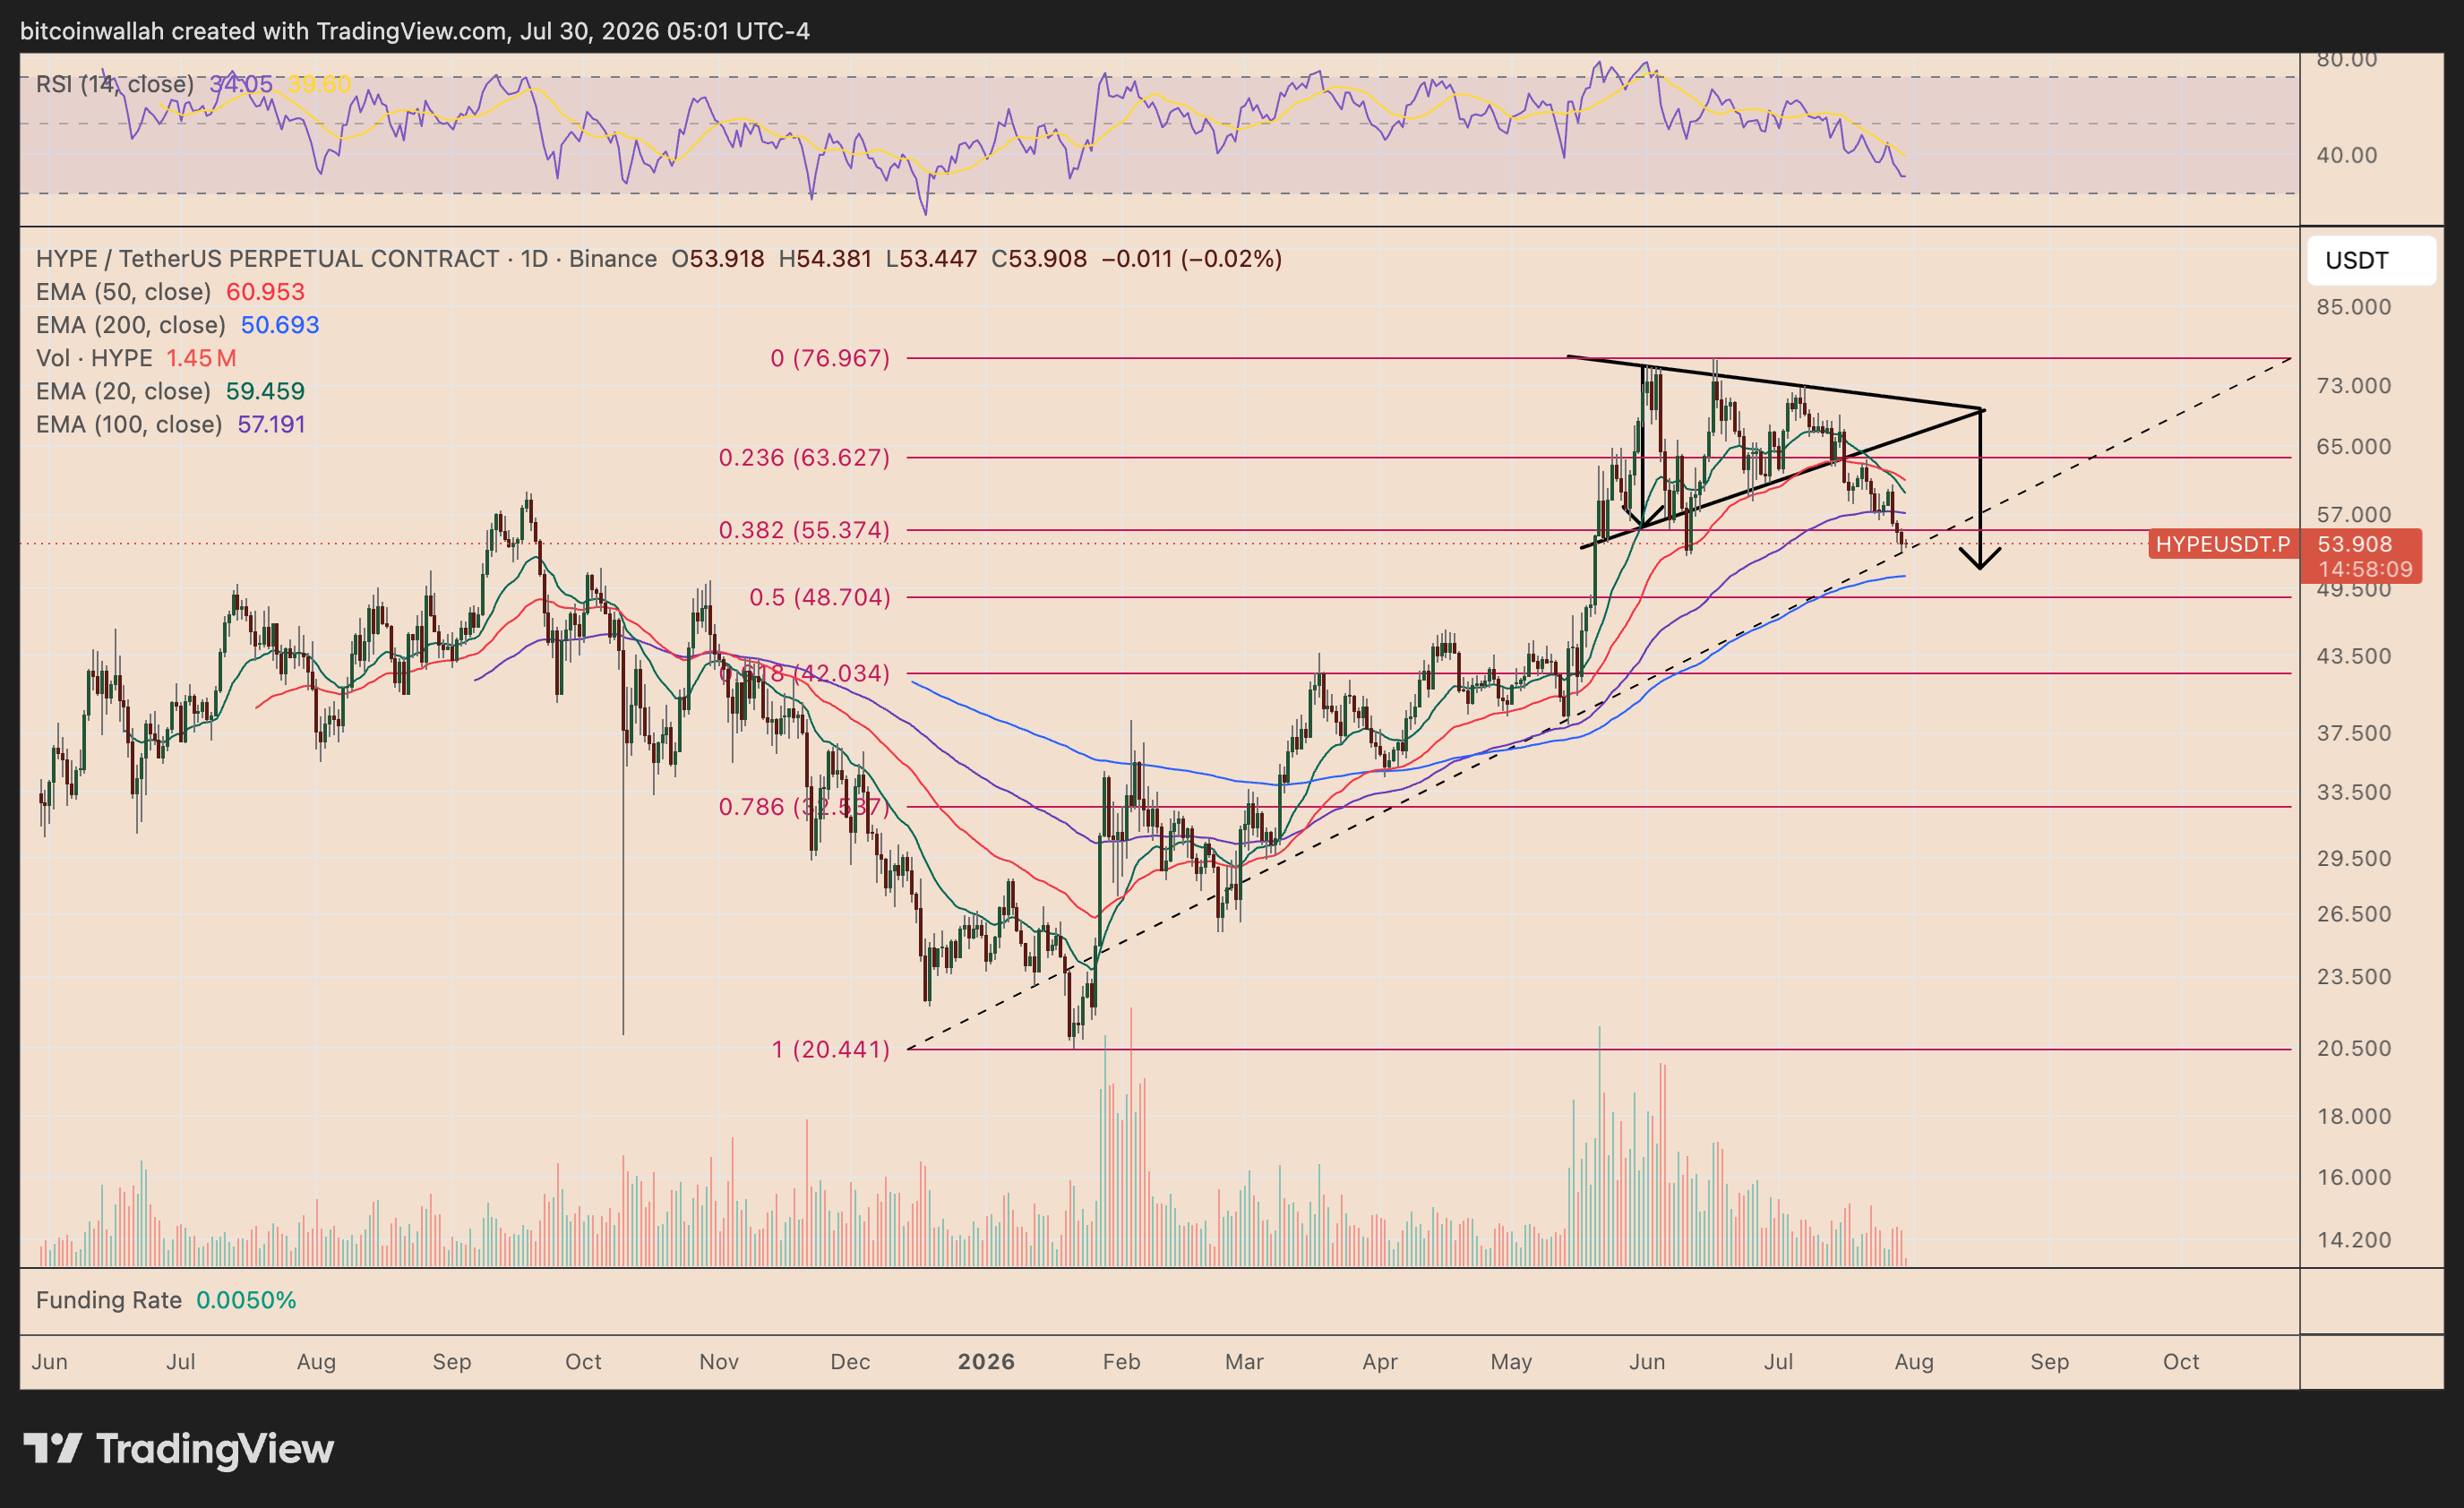
The HYPE/USDT rate has dropped by over 30% from its local high near $77 established over a month ago. As of Thursday, July 30, the pair had dipped to as low as $53.44 as of Thursday, July 30.

This price trajectory saw HYPE forming a symmetrical triangle breakdown pattern, which was still playing out at press time. The setup projects the price to drop further toward $51.40 by the first week of August.

The downside target aligns with the 200-day exponential moving average (200-day EMA, the blue wave) near $50.69, and the 0.5 Fibonacci retracement line near the $0.48 mark.

Hyperliquid's daily relative strength index (RSI) reading was around 34 as of Thursday, just four points above the oversold threshold. This further indicated room for additional declines for the HYPE token.

However, the price may undergo a sharp rebound afterward.

The projected decline toward $50–$51 would also bring HYPE to the lower trendline of a broader bull flag developing since its June peak.

The pattern formed after HYPE rallied sharply from around $39 in May to nearly $77 in June, creating the flagpole. Price has since corrected between two descending, roughly parallel trendlines, forming the flag portion of the bullish continuation setup.

A rebound from the lower boundary, reinforced by the 200-day EMA near $50.69, could push HYPE toward the flag's upper trendline around $63–$64, amounting to a 25% upside.

This area also aligns with the 0.236 Fibonacci retracement level at approximately $63.63.

A decisive daily close above this resistance would confirm the bull flag breakout, potentially sending HYPE back toward its record high near $77. That would amount to gains of roughly 80% from the current price levels.

Conversely, a close below $50 could invalidate the bullish outlook, exposing the $48.70 support level.

Binance's one-week HYPE/USDT liquidation heatmap broadly supports the possibility of an initial decline followed by a rebound, according to data resource CoinGlass.

HYPE was trading near $53.80–$54, with the nearest downside liquidity concentrated around $52.70–$53.00. This cluster could attract price lower in the short term, supporting the projected move toward the bull flag's lower trendline.

However, liquidity becomes relatively thin below approximately $52.50. Therefore, the heatmap supports an initial downside sweep more clearly than a sustained collapse toward $50 or lower.

The larger short liquidation concentrations sit above the current price. Visible upside clusters appear near $55, $56.10, $58.70–$59 and, most notably, around $60.50–$60.80 (around $40 million in cumulative short liquidations).

These levels could act as price magnets if HYPE rebounds from the $51.50–$53 support region. The heatmap therefore strengthens the recovery case toward $59–$61 initially.

This article was originally posted on FX Empire

ONDO Price News: A 20% Drop Likely as Wedge Breakout Halts

US Dollar Price Forecast: Fed Holds Rates, Markets Turn to PCE and BoE Decision

F5 Rises as AI Demand Turns into Revenue

Uniswap Price Prediction: Break Above 200-Day EMA Sets Stage for Explosive Move

Telegram's GRAM Token Teases 40% Rally Despite Pavel Durov Warrant

Forex Forecasts – US Dollar Flexes Strength Across EUR/USD, GBP/USD, and USD/CHF
Comments
You must be logged in to comment.