yahoo Press
ONDO Price News: A 20% Drop Likely as Wedge Breakout Halts
Images
1 / 4
2 / 4

3 / 4

4 / 4
The above button links to Coinbase. Yahoo Finance is not a broker-dealer or investment adviser and does not offer securities or cryptocurrencies for sale or facilitate trading. Coinbase pays us for certain activity generated through this link. Prices displayed are informational.

Ondo Finance's ONDO token has entered a correction after its recent recovery stalled near $0.41.

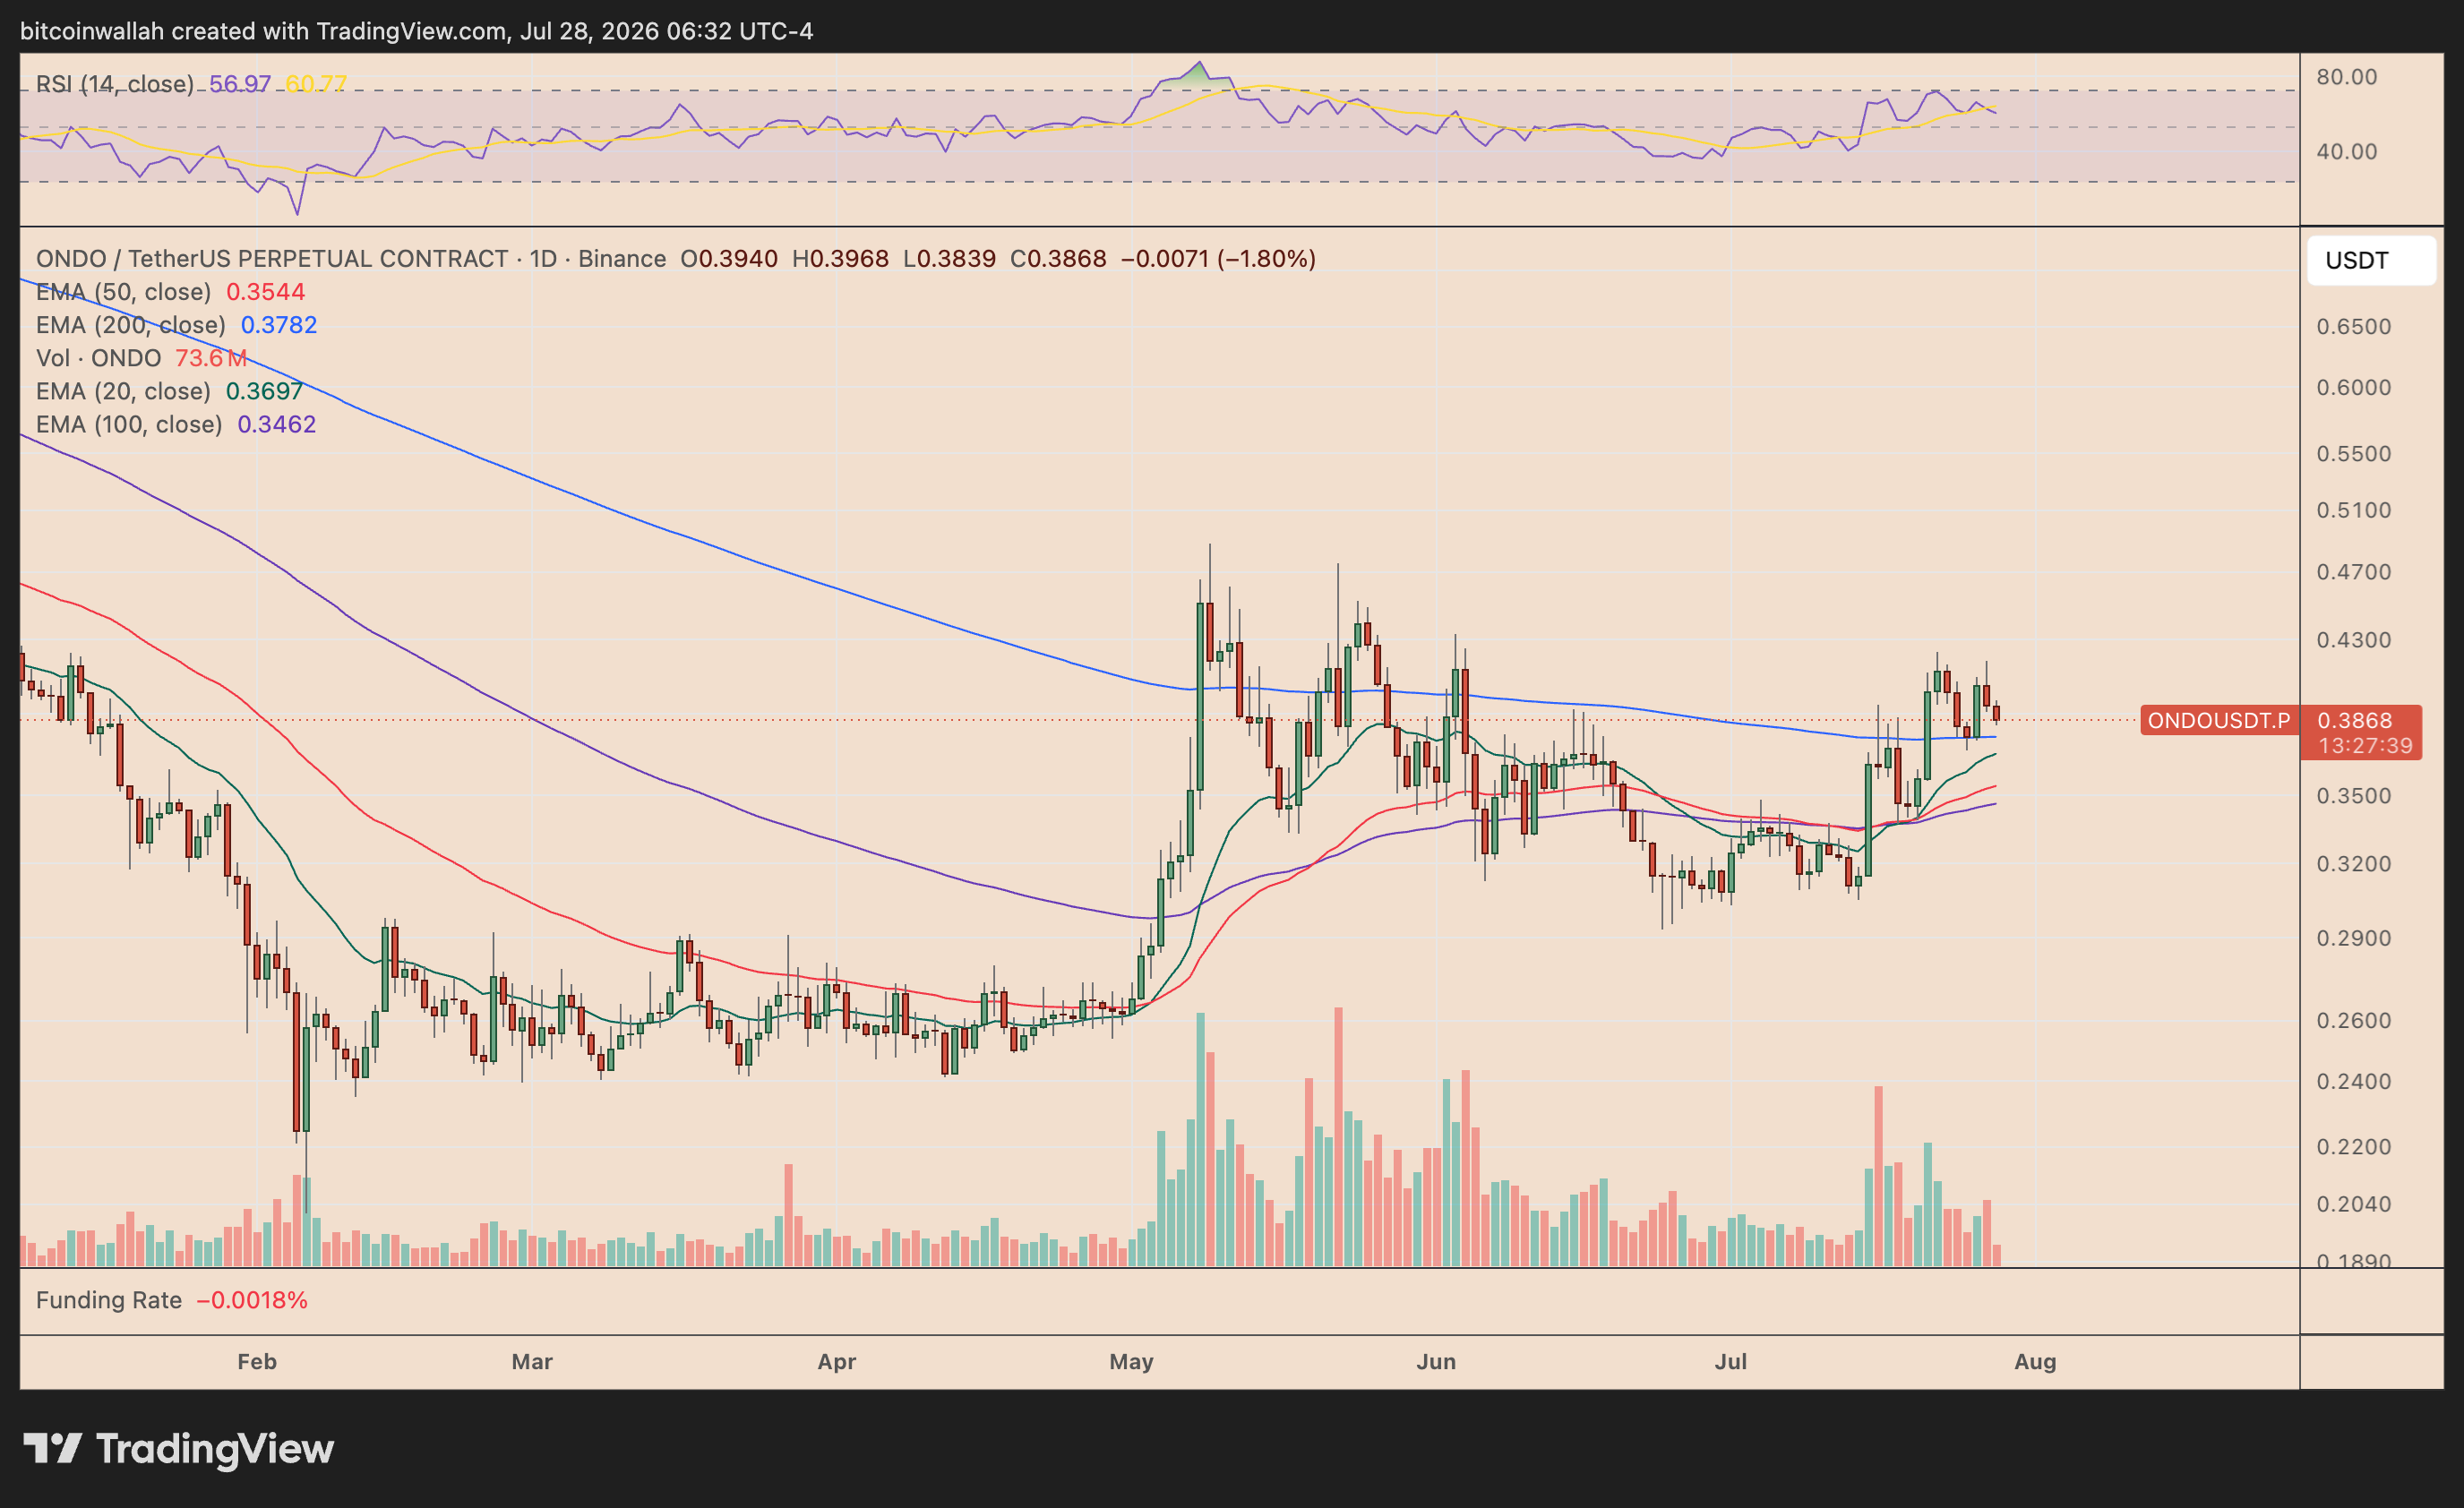
ONDO was trading around $0.384 on Tuesday, July 28, down roughly 2.4% on the day and about 7% below its latest local high. The pullback threatens to erase more of the gains recorded after the token broke out of a falling-wedge pattern earlier this month.

ONDO's rebound appears to have encountered resistance at the upper trendline of a descending channel that has guided its price action since May.

The channel's upper boundary connects the May peak near $0.45 with a series of lower highs, including ONDO's latest rejection around $0.41. Meanwhile, its lower trendline currently sits near $0.30–$0.31.

A continued decline toward this channel support would represent a drop of approximately 20% from current prices.

ONDO is initially testing its 200-day exponential moving average near $0.378. A decisive daily close below this level could expose the 20-day EMA around $0.369.

Further weakness may push the token toward the $0.346–$0.354 area, where its 50-day and 100-day EMAs are located. Losing this moving-average cluster would strengthen the case for a decline toward $0.30–$0.31.

The daily relative strength index (RSI) has also retreated toward 56 after nearing overbought territory during the recent rally. The indicator remains above the neutral 50 level, but its downturn shows that bullish momentum is weakening.

ONDO previously broke above a falling wedge near $0.33–$0.34, producing a technical upside target around $0.49.

However, the breakout rally stalled before reaching the target because of the broader descending-channel resistance near $0.41.

The wedge outlook has not been completely invalidated. ONDO would need a decisive daily close above the $0.41–$0.42 resistance zone to resume the breakout move toward $0.45 and eventually $0.49.

Until that happens, the descending channel favors a deeper correction toward its lower boundary.

This article was originally posted on FX Empire

Bitcoin Bounces as Iran War Pause Pressures Oil: Can BTC Price Reach $70K?

BEAT Price Analysis: A 25% Intraday Pump Brings Major Dump Warnings

MSTR, CRCL, and COIN Forecasts – Crypto Stocks Drift Softly Ahead of Thursday Earnings

Cardano Price Forecast: ADA Could Rally by 180% — Is It Worth the Risk?

AMD, NVDA, and INTC Forecasts – Semiconductor Stocks Test Key 50-Day EMA Support

Zcash Price Forecast: Social Sentiment Indicator Favors Drop to the Low 300s
Comments
You must be logged in to comment.