yahoo Press
Bitcoin Bounces as Iran War Pause Pressures Oil: Can BTC Price Reach $70K?
Images
1 / 4

2 / 4

3 / 4

4 / 4
The above button links to Coinbase. Yahoo Finance is not a broker-dealer or investment adviser and does not offer securities or cryptocurrencies for sale or facilitate trading. Coinbase pays us for certain activity generated through this link. Prices displayed are informational.

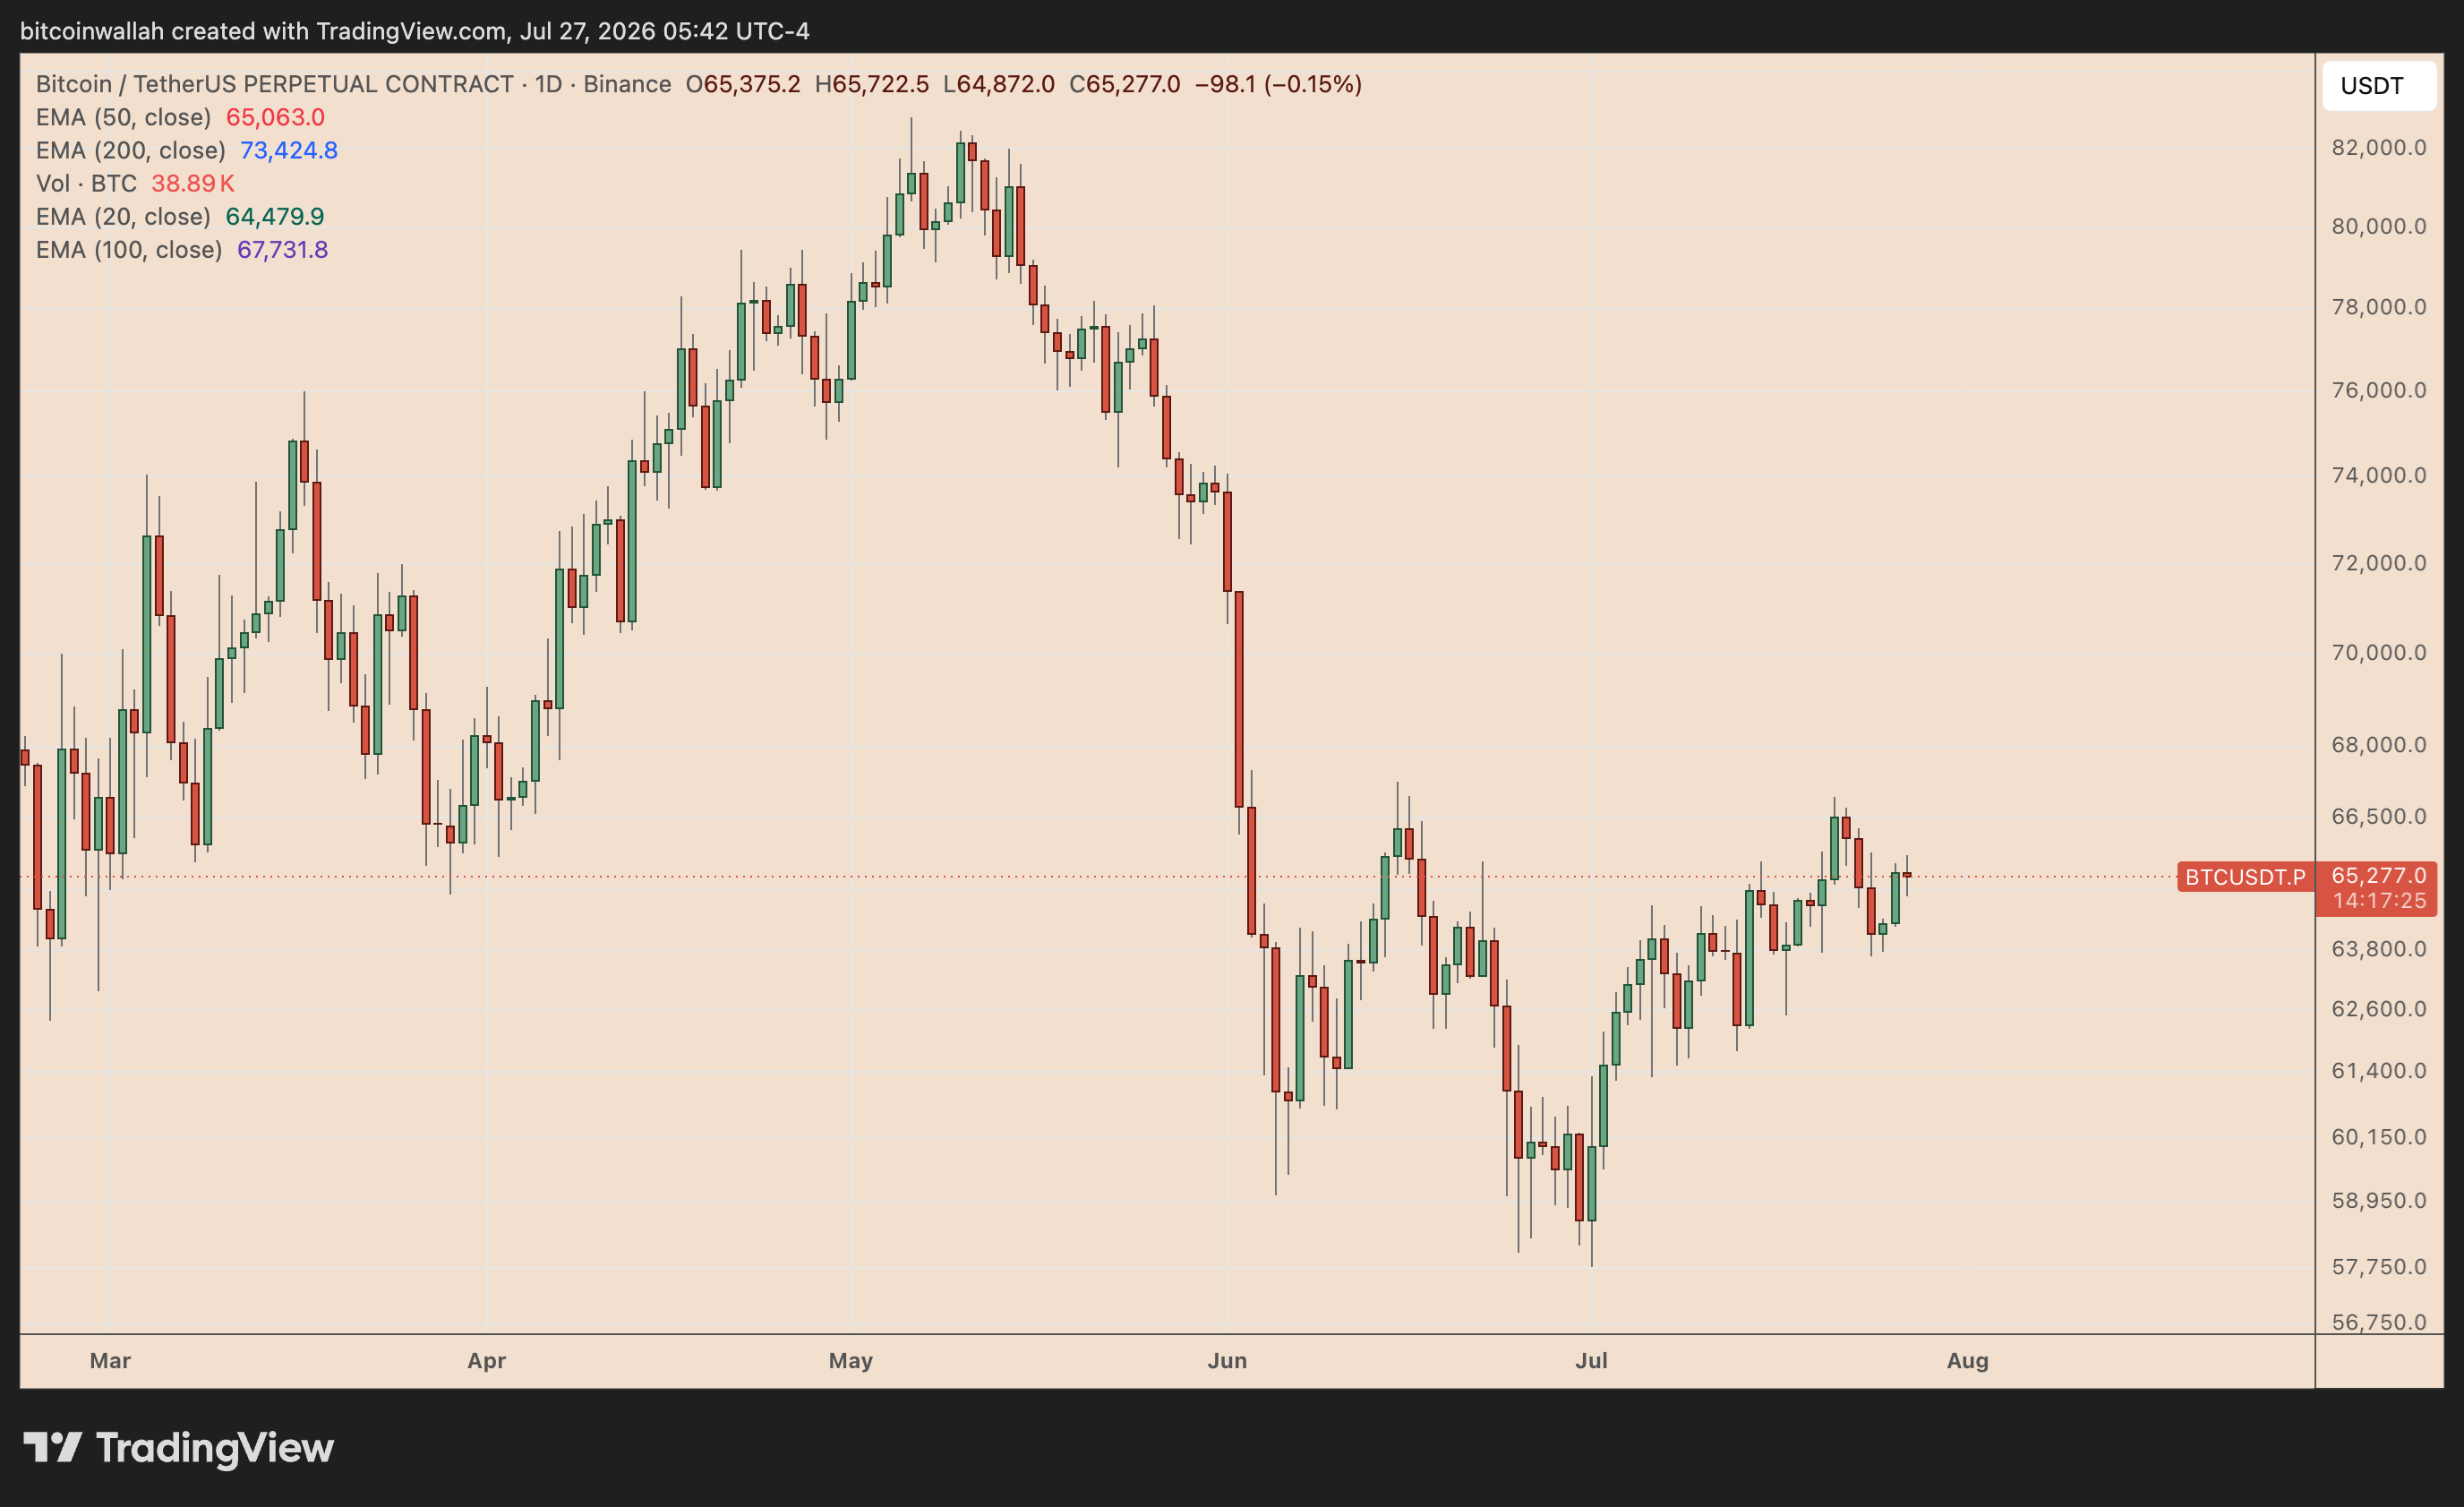
Bitcoin (BTC) bounced over the weekend session and was stabilizing above the $65,000 support as of Monday.

The cryptocurrency climbed more than 3% from its weekend low to reach an intraday high of around $65,722. Its recovery followed a pause in hostilities between the US and Iran, which sent oil prices sharply lower and improved risk appetite across global markets.

Brent crude consequently fell more than 4% toward $92 per barrel, while West Texas Intermediate dropped over 5% to around $84.

Falling energy prices eased concerns that the Iran conflict would trigger another inflation shock and force the Federal Reserve to maintain a more aggressive monetary policy stance.

Lower oil prices are typically supportive for speculative assets because they can reduce inflation expectations, improve liquidity sentiment and limit upward pressure on bond yields.

The odds of a rate hike at the July Fed meeting, due this Wednesday, dropped to around 30% from 37% in a day, according to CME data.

For the September meeting, however, over 56% of bets were in favor of a 25 basis point rate hike, showing that bond traders remained cautious due to seesaw Iran war headlines.

Bitcoin was trading slightly below its 20-period exponential moving average (EMA, green) on the three-day chart, currently near $65,600. Reclaiming this level would strengthen the short-term recovery and put the 50-3D EMA (red) near $70,400 in focus.

The 50-3D EMA also overlaps with the upper trendline of a broader falling wedge pattern, making the $69,000–$70,500 region a key resistance zone. A continued rebound could therefore send Bitcoin toward $70,000 by late July or early August.

A decisive three-day close above the wedge's upper trendline would confirm a bullish breakout. The eventual upside target would depend on where Bitcoin exits the pattern because the distance between its trendlines narrows over time.

For instance, a breakout near the current $69,000 area could project Bitcoin toward approximately $123,000. A later breakout closer to the wedge's projected apex near $54,000 would produce a smaller measured target around $95,000.

Failure to reclaim the 20-3D EMA could keep BTC inside the wedge and trigger another pullback toward its lower trendline. That support appears to converge near $54,000 later in the year.

A decisive break below $54,000 would invalidate the falling-wedge recovery setup and increase the risk of a deeper correction.

This article was originally posted on FX Empire

AI Sales are a Huge Catalyst for Amphenol Shares

USD/CHF, USD/CAD, and USD/MXN Forecasts – Rate Differentials Keep Dollar Buyers in Control

Ethereum Rising Wedge Warns of ETH Price Drop Toward $1.6K

Yen Crosses Forecasts – Rising US Rates and Oil Surge Punish Japanese Yen

Financials Sector Catalyst Sees Dave Shares up 91% YTD

BEAT Price Analysis: A 25% Intraday Pump Brings Major Dump Warnings
Comments
You must be logged in to comment.