yahoo Press
KBWD’s 12 Percent BDC Yield Comes From Loaning to Companies the Big Banks Refuse to Touch
Images
1 / 5
2 / 5

3 / 5

4 / 5
5 / 5
The above button links to Coinbase. Yahoo Finance is not a broker-dealer or investment adviser and does not offer securities or cryptocurrencies for sale or facilitate trading. Coinbase pays us for certain activity generated through this link. Prices displayed are informational.

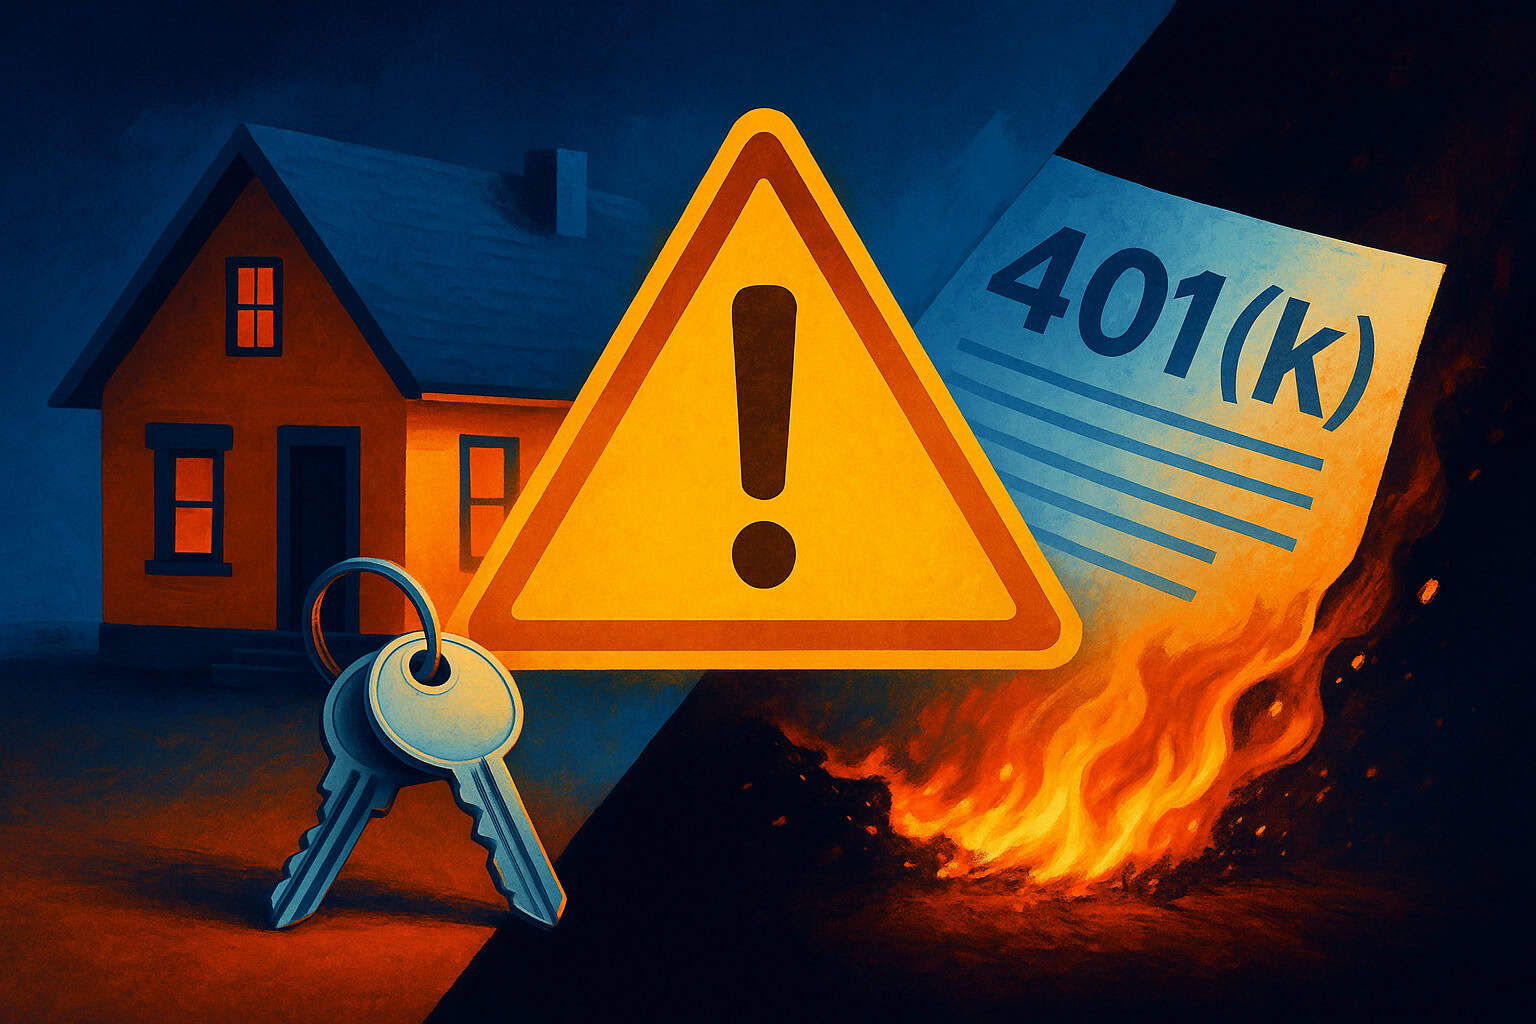
KBWD’s 2.01% expense ratio far exceeds mainstream dividend ETFs like SCHD, reflecting real costs from the BDC structure.

Credit cycle downturns drive simultaneous portfolio hits: rising defaults, falling NAV, and slashed distributions for KBWD shareholders.

The analyst who called NVIDIA in 2010 just named his top 10 stocks and Invesco KBW High Dividend Yield Financial ETF wasn't one of them. Get them here FREE.

The Invesco KBW High Dividend Yield Financial ETF (NASDAQ:KBWD) advertises a distribution yield near 12%, roughly four times what a mainstream dividend ETF pays. The cash arrives monthly and the fund has a track record. What most KBWD holders miss is where that yield comes from: the fund is mostly Business Development Companies (BDCs) that lend to middle market borrowers the big banks have passed on. KBWD is a leveraged credit bet wearing a dividend ETF's clothing.

BDCs are publicly traded lenders that raise capital from equity and bond markets, then originate loans to private middle market companies at yields of roughly 10% to 14%. The spread between funding cost and loan yield is the profit, and by law BDCs distribute most taxable income as dividends. That structure produces KBWD's headline payout. Every dollar of yield compensates for credit risk on borrowers who could not get cheaper loans from regional banks, syndicated desks, or the high yield bond market.

The fund carries an expense ratio near 2.01%, shocking next to the Schwab U.S. Dividend Equity ETF (NYSEARCA:SCHD) at 0.06%. Most of KBWD's expense comes from acquired fund fees within the BDCs themselves, not Invesco's management fee. It is real money leaving the portfolio and the price of accessing this asset class in a single ticker.

The analyst who called NVIDIA in 2010 just named his top 10 stocks and Invesco KBW High Dividend Yield Financial ETF wasn't one of them. Get them here FREE.

The dominant risk in KBWD is the credit cycle. When defaults rise and credit spreads widen, three things happen to BDCs simultaneously. Non-accrual loans climb, directly reducing net investment income. Mark-to-market portfolio values fall, dragging net asset value lower. BDCs often cut distributions to preserve capital, forcing KBWD's payout down with them.

Recent history makes this concrete. During March 2020 stress, KBWD fell 34% in the first half of that year, with deeper intra-quarter drawdowns before recovery. A retiree who put $50,000 into KBWD expecting $6,000 of annual income would have watched principal cut nearly in half within weeks, with several portfolio BDCs cutting distributions. The yield reflects exactly that scenario as a probability.

The credit environment is calm but not cheap. The 10Y-2Y Treasury spread sits at 0.50%, below its 12-month average of 0.6% and flattening from a February peak of 0.74%. The VIX is around 17, near its 12-month median. KBWD shares are at $12.63, down about 3% year to date and up 3% over the past year. The yield curve signals slower growth ahead, exactly the environment where leveraged middle market borrowers struggle on refinancings.

The closest peer is the VanEck BDC Income ETF (NYSEARCA:BIZD), which tracks a market cap weighted BDC index rather than KBWD's yield weighted approach. BIZD is down 11% over the past year and 8% year to date, worse than KBWD on both windows. Its 10-year total return of 116% dwarfs KBWD's 68%. KBWD's higher current yield tends to come with greater capital decay over full cycles because tilting toward the highest yielding BDCs systematically overweights the riskiest underwriters.

Three indicators signal when credit is turning before KBWD's price does:

The 10Y-2Y Treasury spread on FRED. An inversion signals deteriorating refinancing conditions. The current reading of 0.50% is positive but in the lower quartile of its 12-month range.

Aggregate BDC non-accrual rates in quarterly filings. A move from low single digits toward 5% historically precedes distribution cuts.

High yield credit spreads (ICE BofA US High Yield Index OAS on FRED). When that spread blows out past 500 basis points, BDC NAVs almost always follow.

KBWD is doing exactly what it was designed to do: pay a high distribution by owning the highest yielding slice of the BDC universe. The risk is the price of admission. For an investor who understands that the 12% yield can fall in a credit downturn and that share price can drop sharply alongside it, KBWD is a coherent way to access middle market private credit. For an investor who picked it over SCHD purely on yield numbers, the position is larger than it looks. Watching the credit curve, not the dividend calendar, is the job.

This analyst's 2025 picks are up 106% on average. He just named his top 10 stocks to buy in 2026. Get them here FREE.
Comments
You must be logged in to comment.