yahoo Press
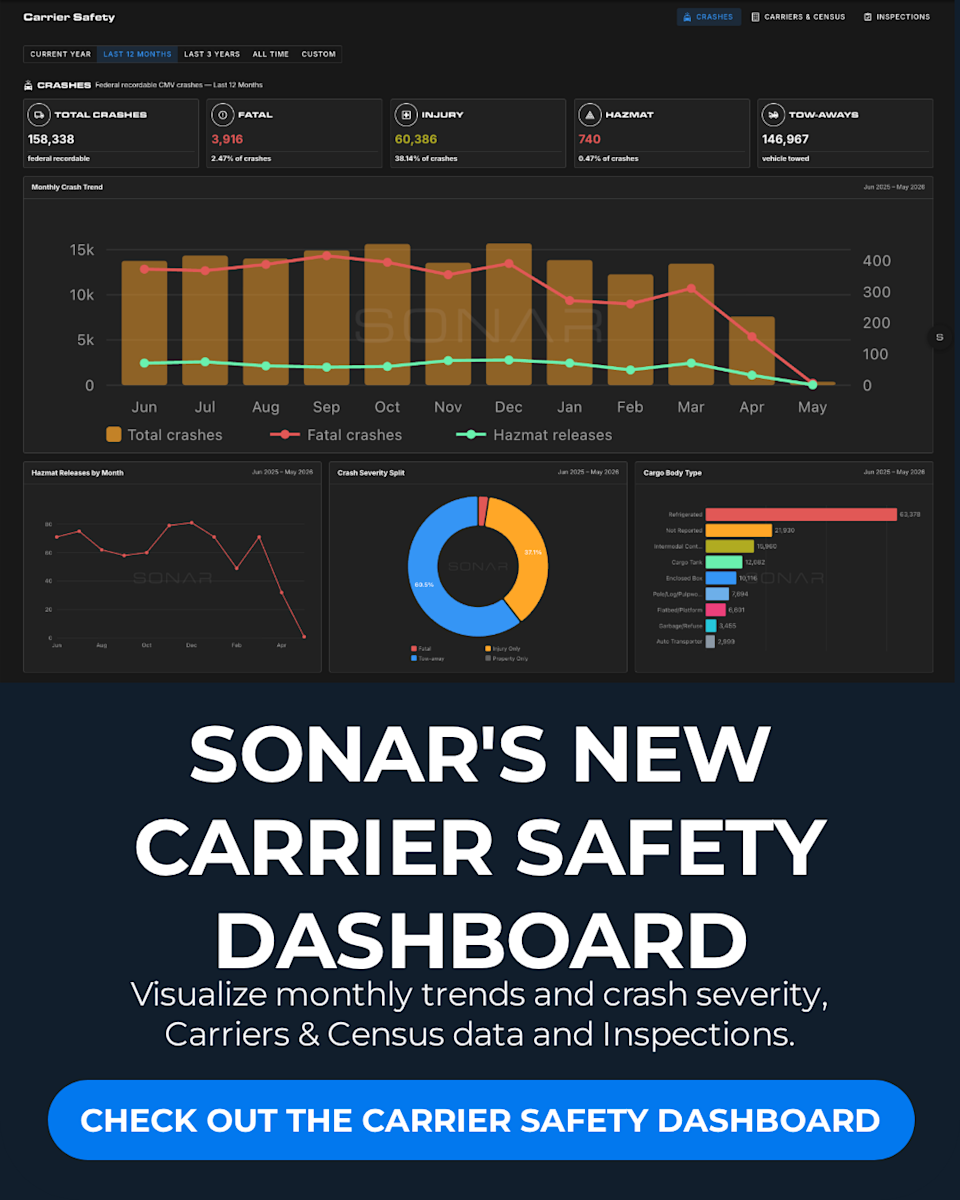
SONAR Launches Carrier Safety Dashboard — Right on Time for International Roadcheck Week
Images

1 / 7

2 / 7

3 / 7

4 / 7
5 / 7
6 / 7

7 / 7
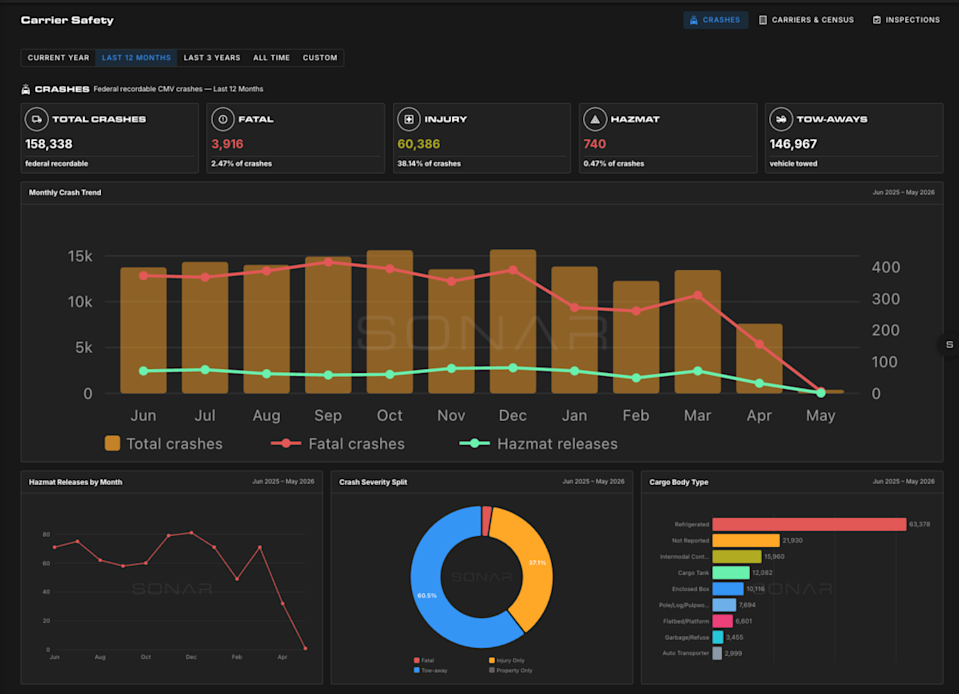
New FMCSA and CSA intelligence tool goes live as North American enforcement enters its most intense 72 hours of the year — and as the CDL crackdown reshapes the driver pool in real time

CHATTANOOGA, Tenn. — May 12, 2026 — SONAR today announced the launch of its new Carrier Safety Dashboard, a comprehensive intelligence tool that centralizes Federal Motor Carrier Safety Administration (FMCSA) and Compliance, Safety, Accountability (CSA) data — including crashes, carriers and census, roadside inspections, and an in-depth view of out-of-service (OOS) violations — into a single, interactive platform.

The dashboard goes live on the opening day of the 2026 CVSA International Roadcheck, the largest targeted commercial motor vehicle enforcement event in the world — and at a moment when the non-domiciled CDL crackdown is already driving structural change in carrier safety compliance across the country.

Access the Carrier Safety Dashboard now at sonar.surf/fmcsa-dashboard.

What’s Inside the Carrier Safety Dashboard

The dashboard is organized into three primary modules, each filterable by current year, last 12 months, last 3 years, all time, or a custom date range.

The crash module presents federal recordable CMV crash data across five key metrics: total crashes, fatal crashes, injury-only crashes, hazmat-involved crashes, and tow-aways. Over the last 12 months, SONAR’s dashboard shows 158,338 total federal recordable crashes, including 3,916 fatal crashes (2.47% of total), 60,386 injury crashes (38.14%), 740 hazmat incidents, and 146,967 vehicles towed.

A monthly crash trend chart breaks out total crashes, fatal crashes, and hazmat releases over time, while lower-panel charts display hazmat releases by month, crash severity split, and cargo body type — with refrigerated trailers representing the highest-volume crash category at 63,378 incidents over the period.

The carriers module provides a full view of the registered carrier population. Over the last 12 months, 172,689 carriers have been registered across all operating types: 99,358 interstate (A), 67,325 intrastate non-hazmat (C), and 4,027 intrastate hazmat (B). A geographic heat map illustrates carrier concentration by state, with California and Texas leading all other states by a significant margin.

The inspections module aggregates roadside inspection data across driver and vehicle categories. Over the last 12 months, the dashboard shows 2,908,513 total roadside inspections, with 579,831 OOS violations and 13,220 hazmat violations — including 4,236 hazmat OOS orders. California and Texas lead all states in inspection volume, followed by North Carolina, New York, and a cluster of southern and midwestern states. By inspection level, walk-around (Level II) inspections account for 36.0% of all inspections, driver-only (Level III) for 35.2%, and full (Level I) for 25.8%.

The OOS module provides the deepest analytical layer in the dashboard. With 2,284,768 total OOS violations recorded and an overall OOS rate of 17.5%, the data surfaces which regulatory categories are generating the most enforcement action — and where that enforcement converts most aggressively to trucks being pulled from service.

By CFR Part, §393 (Parts & Accessories — Brakes, Lights, Tires) is the leading source of both all violations and OOS violations, followed by §392. A side-by-side bar chart for the top 10 CFR Parts makes the gap between total violations and OOS conversions immediately visible.

By CSA BASIC category, Vehicle Maintenance leads at 20.7% of OOS violations, followed by Unsafe Driving (14.2%), Hours of Service (11.3%), Hazardous Materials (8.5%), Driver Fitness (6.1%), Driving of CMVs (4.5%), and Lights/Electrical (4.0%) — with all other categories comprising the remaining 30.9%.

Why the Timing Matters: International Roadcheck Begins Today

The 2026 CVSA International Roadcheck runs May 12–14, during which certified inspectors across the U.S., Canada, and Mexico will conduct an average of 15 inspections per minute over 72 hours. This annual enforcement blitz is the single largest concentrated data-collection and enforcement event in commercial motor vehicle safety — and its results flow directly into CSA scores, OOS records, and FMCSA databases that now live inside SONAR’s new dashboard.

This year’s Roadcheck carries two areas of special enforcement focus:

Driver Focus: ELD Tampering, Falsification, or Manipulation — Inspectors will scrutinize driver records of duty status for anomalies, suspicious edits, and patterns inconsistent with routes and timing. Last year, falsification of records was the second most-cited driver violation across all of North America at 58,382 violations. A driver found with a falsified log faces a 10-hour out-of-service order — harsher than the 4–5 hours typically imposed for an underlying HOS violation — plus a more damaging entry on their inspection record.

Vehicle Focus: Cargo Securement — In 2025, 18,108 violations were issued for cargo not secured to prevent leaking, spilling, or falling, and 16,054 more for unsecured vehicle components or dunnage. The 2026 Roadcheck will emphasize that loads must be contained, immobilized, and secured against all forms of roadway hazard.

Roadcheck week has historically tightened spot freight rates as some drivers elect to park their trucks rather than risk inspection, capacity temporarily exits the market, and tender rejection rates rise. With the freight market already showing signs of structural tightening — OTRI.USA running at 14.43%, approximately 12% above its 6-month average — the enforcement event lands on an already sensitive capacity environment. For a full analysis of what Roadcheck week means for freight rates and market dynamics, see FreightWaves’ Chart of the Week: What Roadcheck Week Means for the Freight Market.

The CDL Crackdown: A New Layer of OOS Exposure

The dashboard launch comes as the non-domiciled CDL enforcement wave introduces a category of OOS risk that did not exist at scale one year ago — and that makes the Driver Fitness BASIC category inside SONAR’s OOS deep dive one of the most closely watched data points in the industry right now.

On March 16, 2026, an FMCSA Final Rule took effect limiting non-domiciled CDL eligibility to a narrow set of verifiable nonimmigrant visa categories. FMCSA estimates that 97% of the approximately 200,000 non-domiciled CDL holders nationwide will not qualify under the new requirements. California cancelled 13,000 licenses in early March. New York lost $73.5 million in federal highway funding after refusing to revoke approximately 17,000 contested CDLs — licenses that a federal audit found were issued with a 53% failure rate against lawful presence documentation requirements.

The enforcement consequence is direct: a driver operating with an invalid CDL during a roadside inspection — including during Roadcheck week — is placed out of service immediately. In severe cases, carriers can receive acute violation status, limiting fleet-wide operations. SONAR’s ELPVOOS.USA index — which tracks English Language Proficiency and driver qualification OOS violations — has spiked 110% above its pre-2025 baseline and remains structurally elevated at +71% above pre-2025 levels. Each OOS event removes a truck for the day and triggers a compliance review. The new Carrier Safety Dashboard is the first SONAR tool to bring this enforcement data into a centralized, filterable visual environment where carriers can benchmark their own exposure and monitor the national trend.

For the full analysis of the CDL crackdown, its regulatory timeline, state-by-state enforcement actions, and freight market implications — including J.B. Hunt’s projection of 214,000–437,000 drivers potentially removed from the workforce over the next two to three years — read the SONAR blog: The CDL Crackdown Is Here. Here’s What It Means for U.S. Freight.

For the live SONAR Sitrep — tracking OTRI, NTIL, VCRPM1, ROTRI, ELPVOOS, OTVI, and CDNCA signals as the supply correction unfolds — visit: sonar.surf/sitreps?tab=cdl-crackdown

And for context on the deferred maintenance backlog that carriers are carrying out of the freight recession — a compounding risk factor heading into peak Roadcheck enforcement — see the SONAR Fleet Maintenance Sitrep: SONAR Sitrep: Fleet Maintenance — Behind the Curve Post-Freight Recession

Access the SONAR Sitrep on Maintenance and Trucking safety here.

Why SONAR Built This Now

The regulatory environment has fundamentally changed what it means to operate a compliant fleet in 2026. Between the CDL enforcement wave, Roadcheck’s ELD and cargo securement focus, and a freight market where capacity tightening is already visible in SONAR’s leading indices, the need for a single source of truth on carrier safety data has never been more acute.

The SONAR Carrier Safety Dashboard gives freight stakeholders the centralized, up-to-date intelligence they need — whether evaluating their own compliance posture, assessing the carrier base supporting a routing guide, managing broker risk, or monitoring the national enforcement environment heading into the most active inspection period of the year.

Access the Dashboard

The SONAR Carrier Safety Dashboard is available now to SONAR subscribers at sonar.surf/fmcsa-dashboard.

Not yet a SONAR subscriber? Schedule a consultation at GoSONAR.com to see the full platform — including the Carrier Safety Dashboard, SONAR Sitreps, and the full suite of freight market intelligence tools.

The post SONAR Launches Carrier Safety Dashboard — Right on Time for International Roadcheck Week appeared first on FreightWaves.
Comments
You must be logged in to comment.