yahoo Press
If Iran war sends oil prices up 100%, here's what history says will happen to the stock market
Images
1 / 7
2 / 7

3 / 7

4 / 7

5 / 7
6 / 7

7 / 7
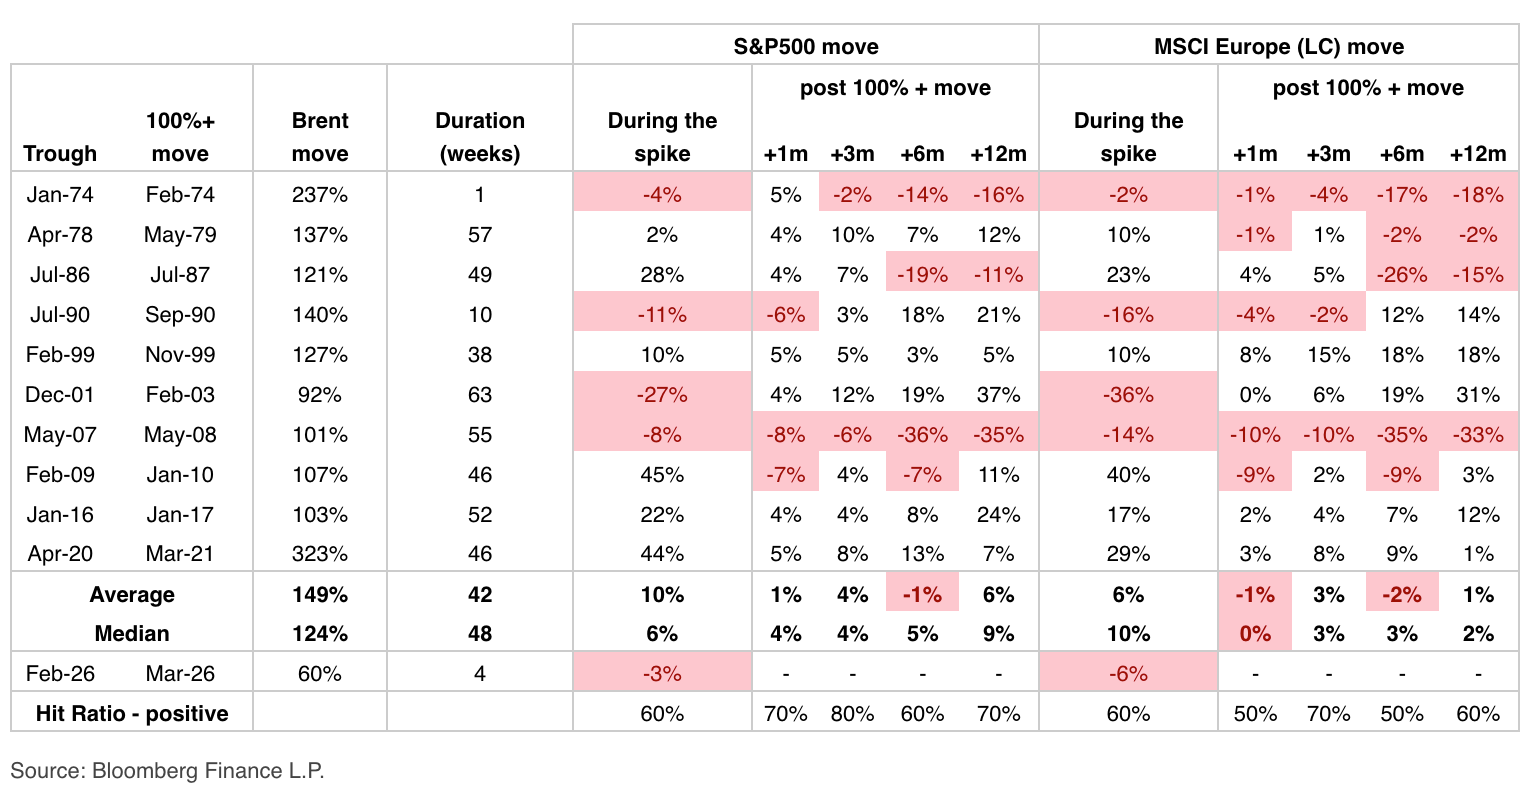
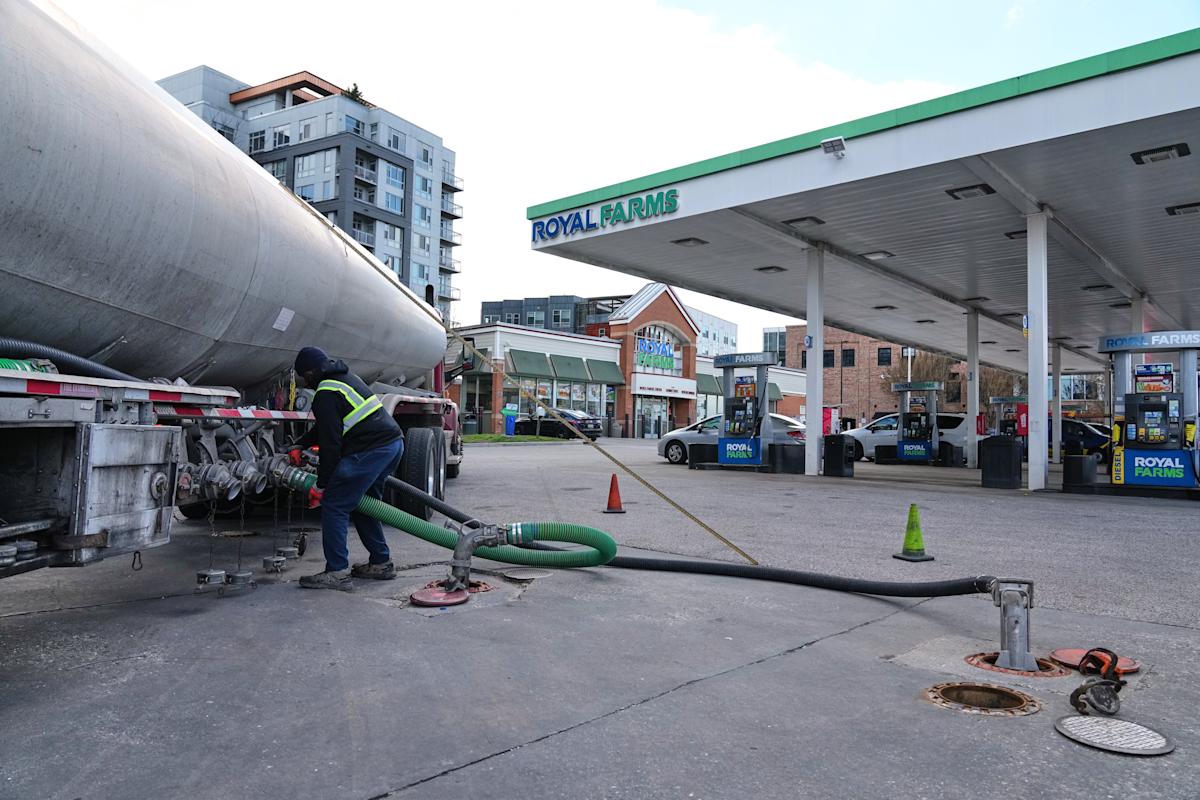
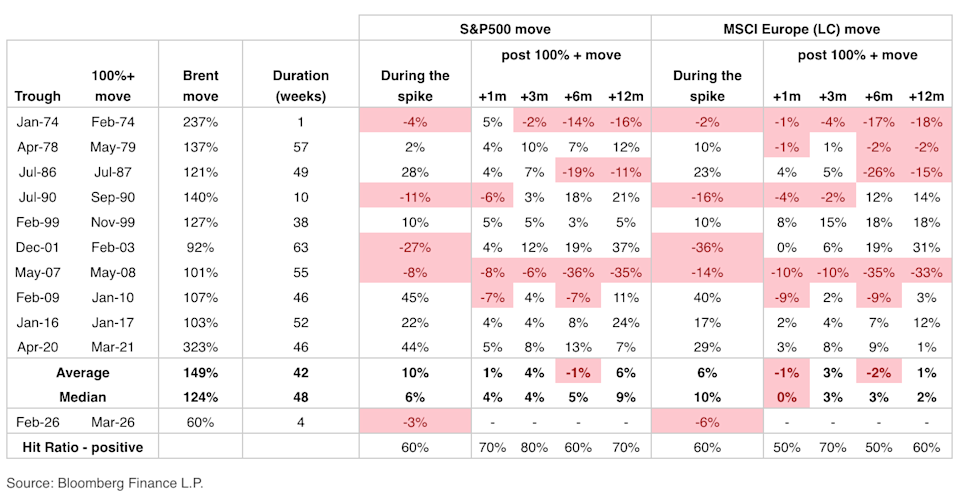
Short-term pain followed by some gain down the line — that's how history has handled significant oil price shocks, according to new data pulled from JPMorgan.

Going back to 1974, in periods where oil prices have spiked more than 100%, the median performance of the S&P 500 (^GSPC) has been higher one month, three months, six months, and one year following the surge in crude (BZ=F) (chart below). The S&P 500 has a median gain of 6% during the oil price spike period.

But don't get too warm and fuzzy, JPMorgan warned.

"Clearly, if oil prices spike further from here — and the targeting of Gulf production capacity makes a move toward $120-$130 and potentially higher more plausible — equities would have to reprice lower," JPMorgan strategist Mislav Matejka said.

The price of oil is likely to remain the main market driver in the near term.

Since the launch of Operation Epic Fury on Feb. 28, global energy markets have experienced a violent "war premium" being built into prices.

Oil prices, which had been around $72 per barrel before the US strikes on Iran, instantly surged. The closure of the Strait of Hormuz has placed 20% of global supply at risk. Brent crude briefly peaked at a staggering $119 per barrel in early March before settling into a volatile range.

As of today, oil is trading near $113 per barrel, a nearly 60% increase in less than a month.

Read more: How oil price shocks ripple through your wallet, from gas to groceries

The rise in oil prices has started to hit consumers' wallets, with the average price of gas across the country approaching $4 per gallon. Diesel prices have soared, pressuring trucking operations.

"[Higher gas prices are] absolutely recessionary in the short term," former Trump administration insider Gary Cohn said on Yahoo Finance's Opening Bid (video above).

"There's nothing more instantaneous to a consumer than standing there holding down the gas nozzle and watching the numbers tick on the pump," he said. "And if they were paying $80 a week ago, and they're paying $85 this week, and they were paying $60 a month ago, they know that 'I lost $20 of disposable income in filling up this tank of gas.'"

Cohn added, "If you're filling up four times a week, that's $80 of disposable income coming out of your pocket after tax, disposable income. That's the difference between taking your family out to dinner and not taking your family out to dinner a couple times in a week."

Meanwhile, the S&P 500 (^GSPC) has faced its most significant technical breakdown since early 2025.

After peaking at an all-time high of 6,797 in January, the benchmark index has notched four consecutive losing weeks, officially dipping below its 200-day moving average on March 19.

Currently trading around 6,506, the S&P 500 is down roughly 6% from its record highs. The sell-off has hit market leadership areas such as the "Magnificent Seven" — for instance, shares of AI chip king Nvidia (NVDA) have slipped below the important 200-day moving average.

"Understand your risk tolerance and your ability to deal with these kinds of ups and downs and curveballs, because these will always happen," Edward Jones CEO Penny Pennington said on Opening Bid.

Brian Sozzi is Yahoo Finance's Executive Editor and a member of Yahoo Finance's editorial leadership team. Follow Sozzi on X @BrianSozzi, Instagram, and LinkedIn. Tips on stories? Email brian.sozzi@yahoofinance.com.

Click here for in-depth analysis of the latest stock market news and events moving stock prices

Read the latest financial and business news from Yahoo Finance
Comments
You must be logged in to comment.